Analytics and Data Driven Decision Making
Analytics typology
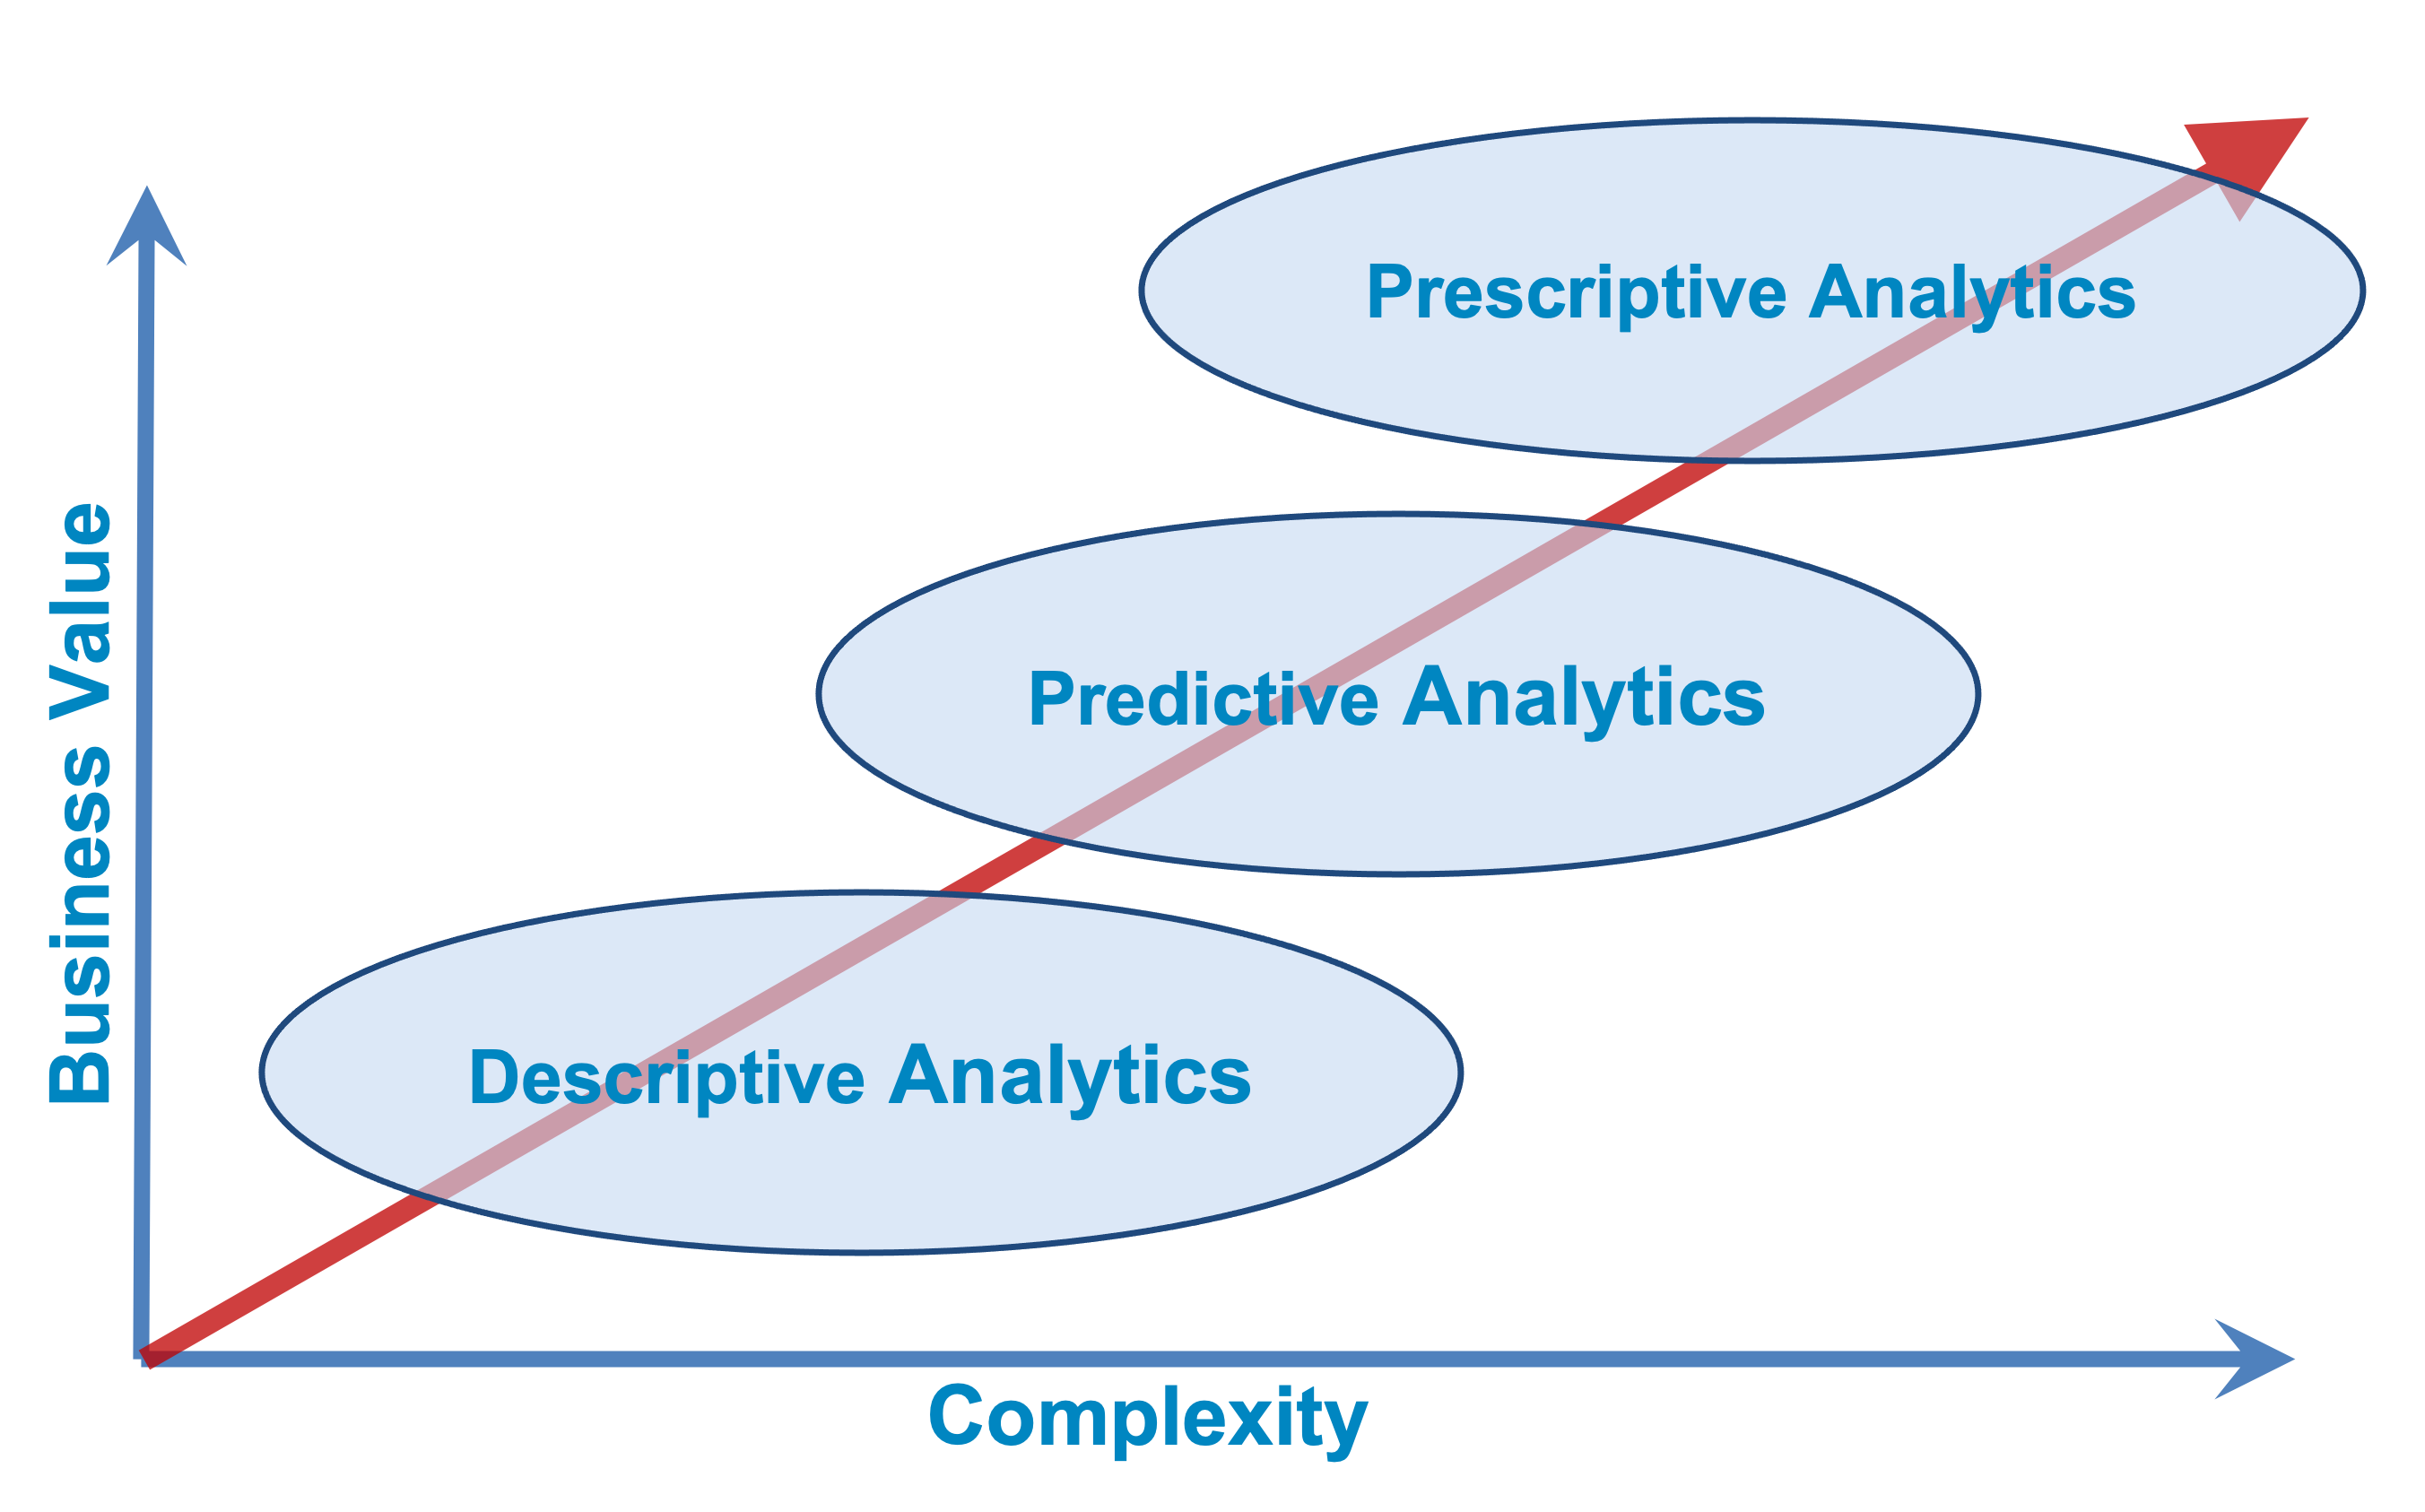
What happened and why?
What is likely to happen?
What should I do?
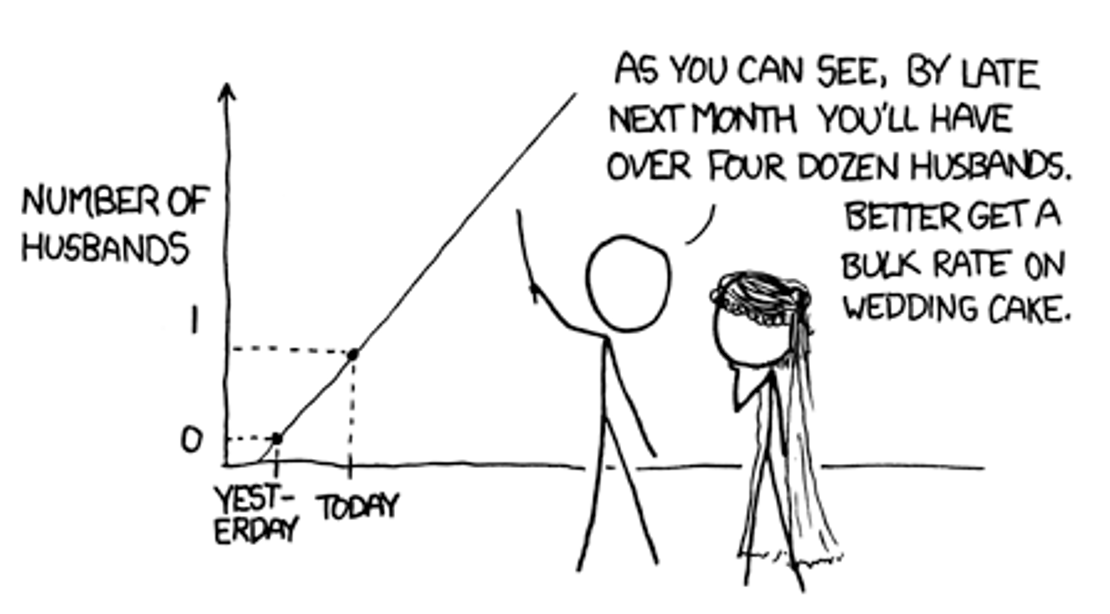
The turkey illusion

Extrapolating
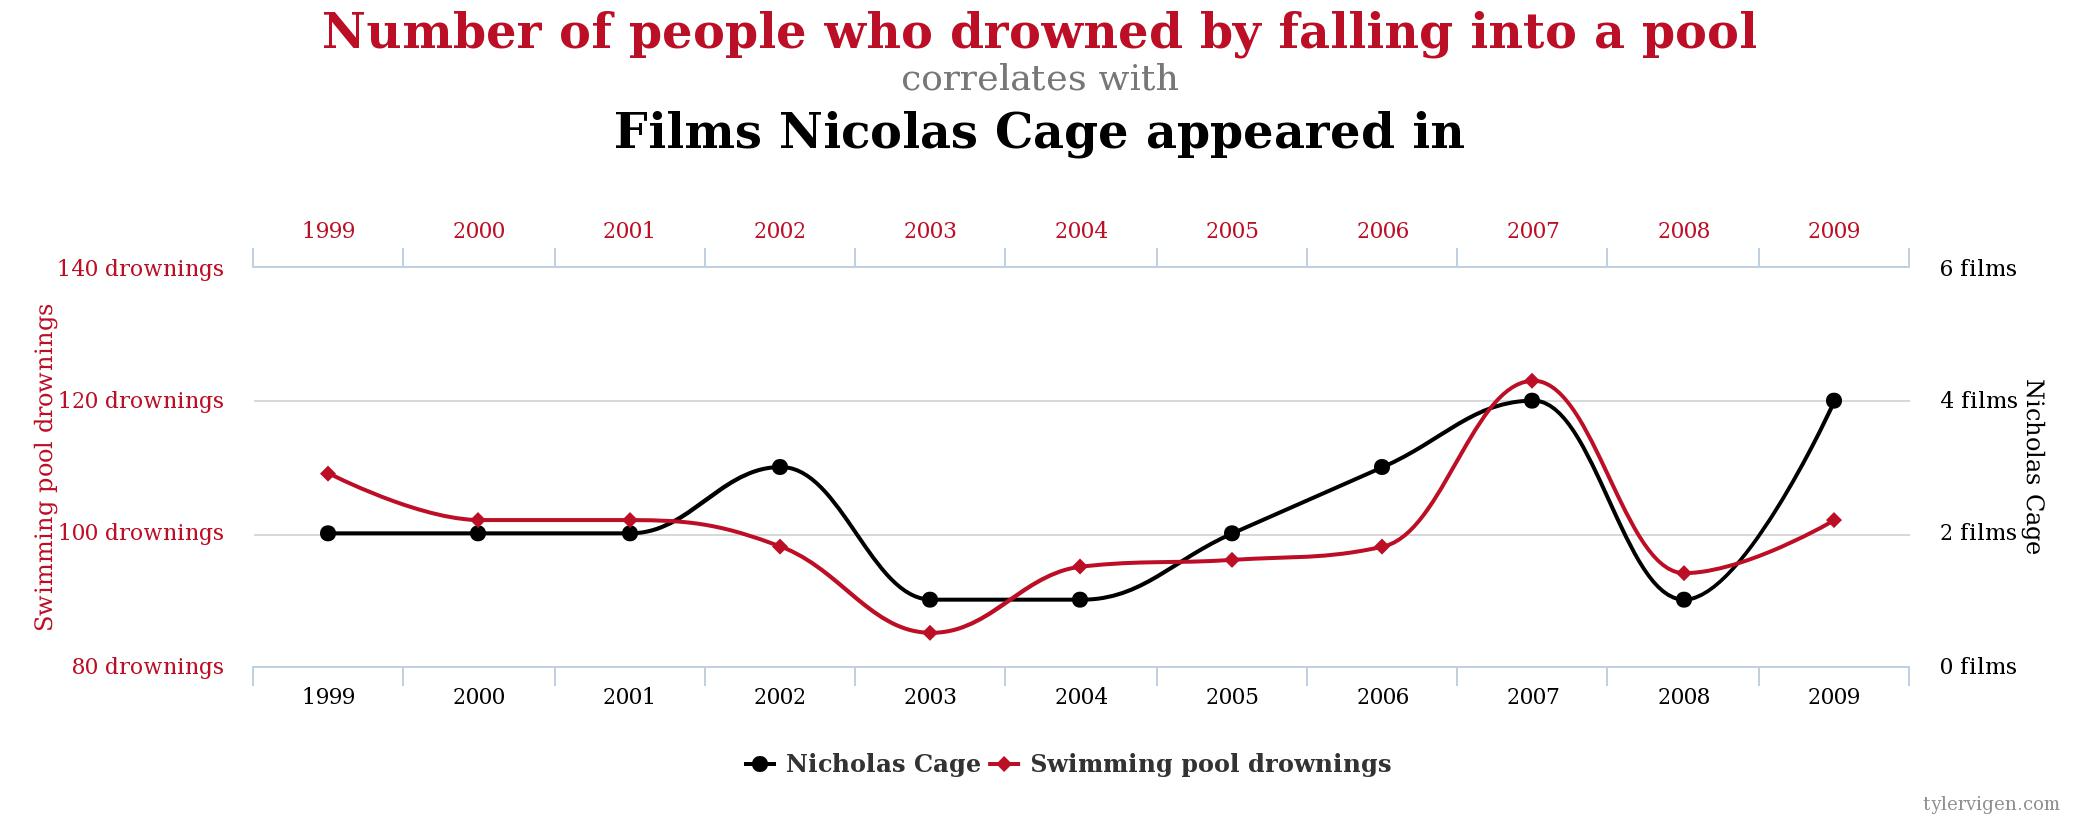
Illusory correlation
Simpson’s paradox
Example: Gender bias?
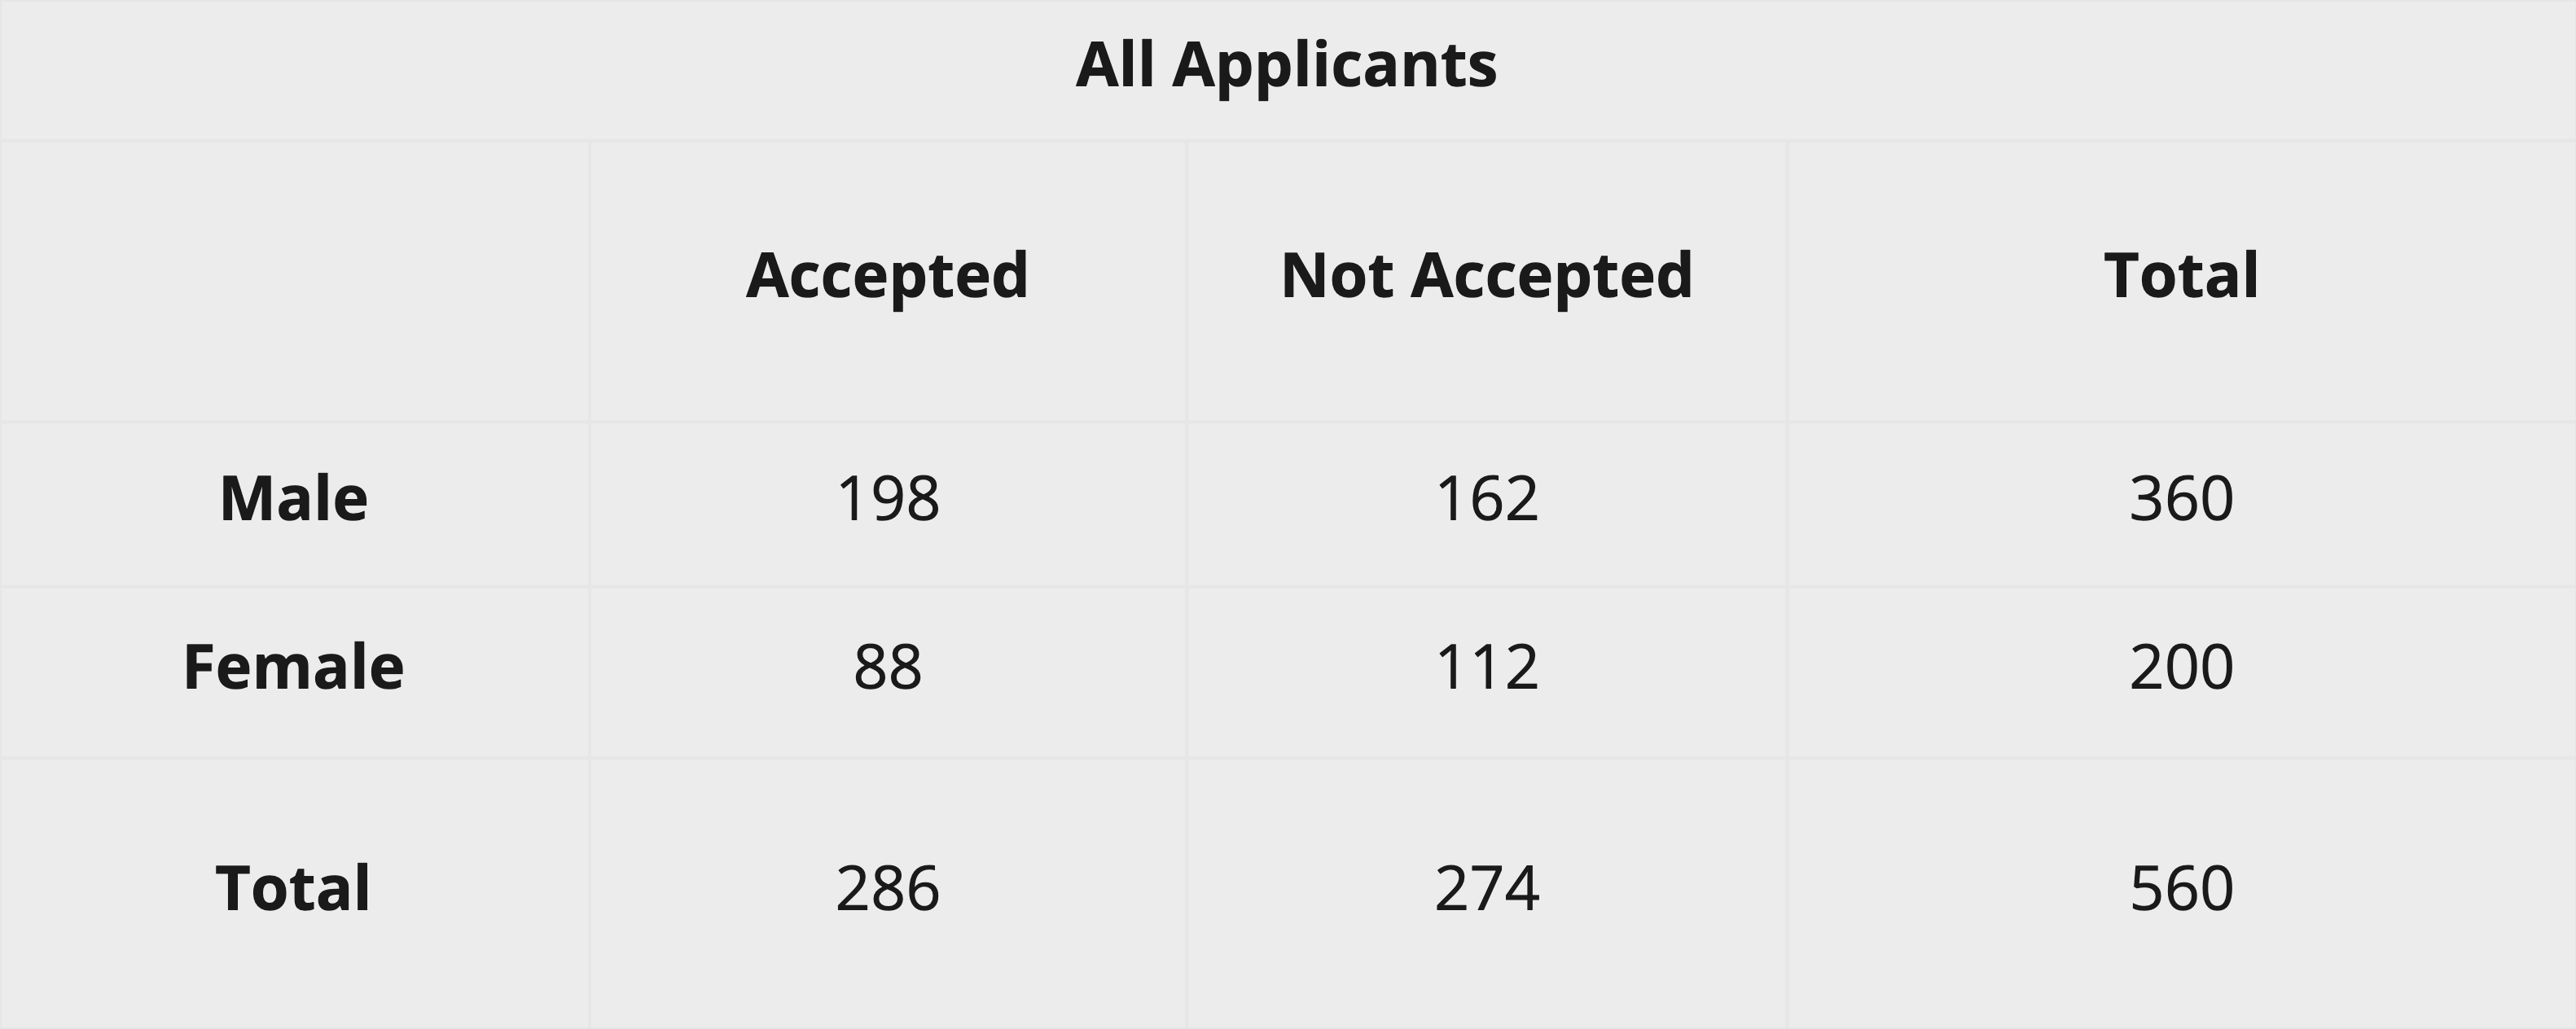
Question: Is acceptance into UC Berkeley graduate school associated with gender?
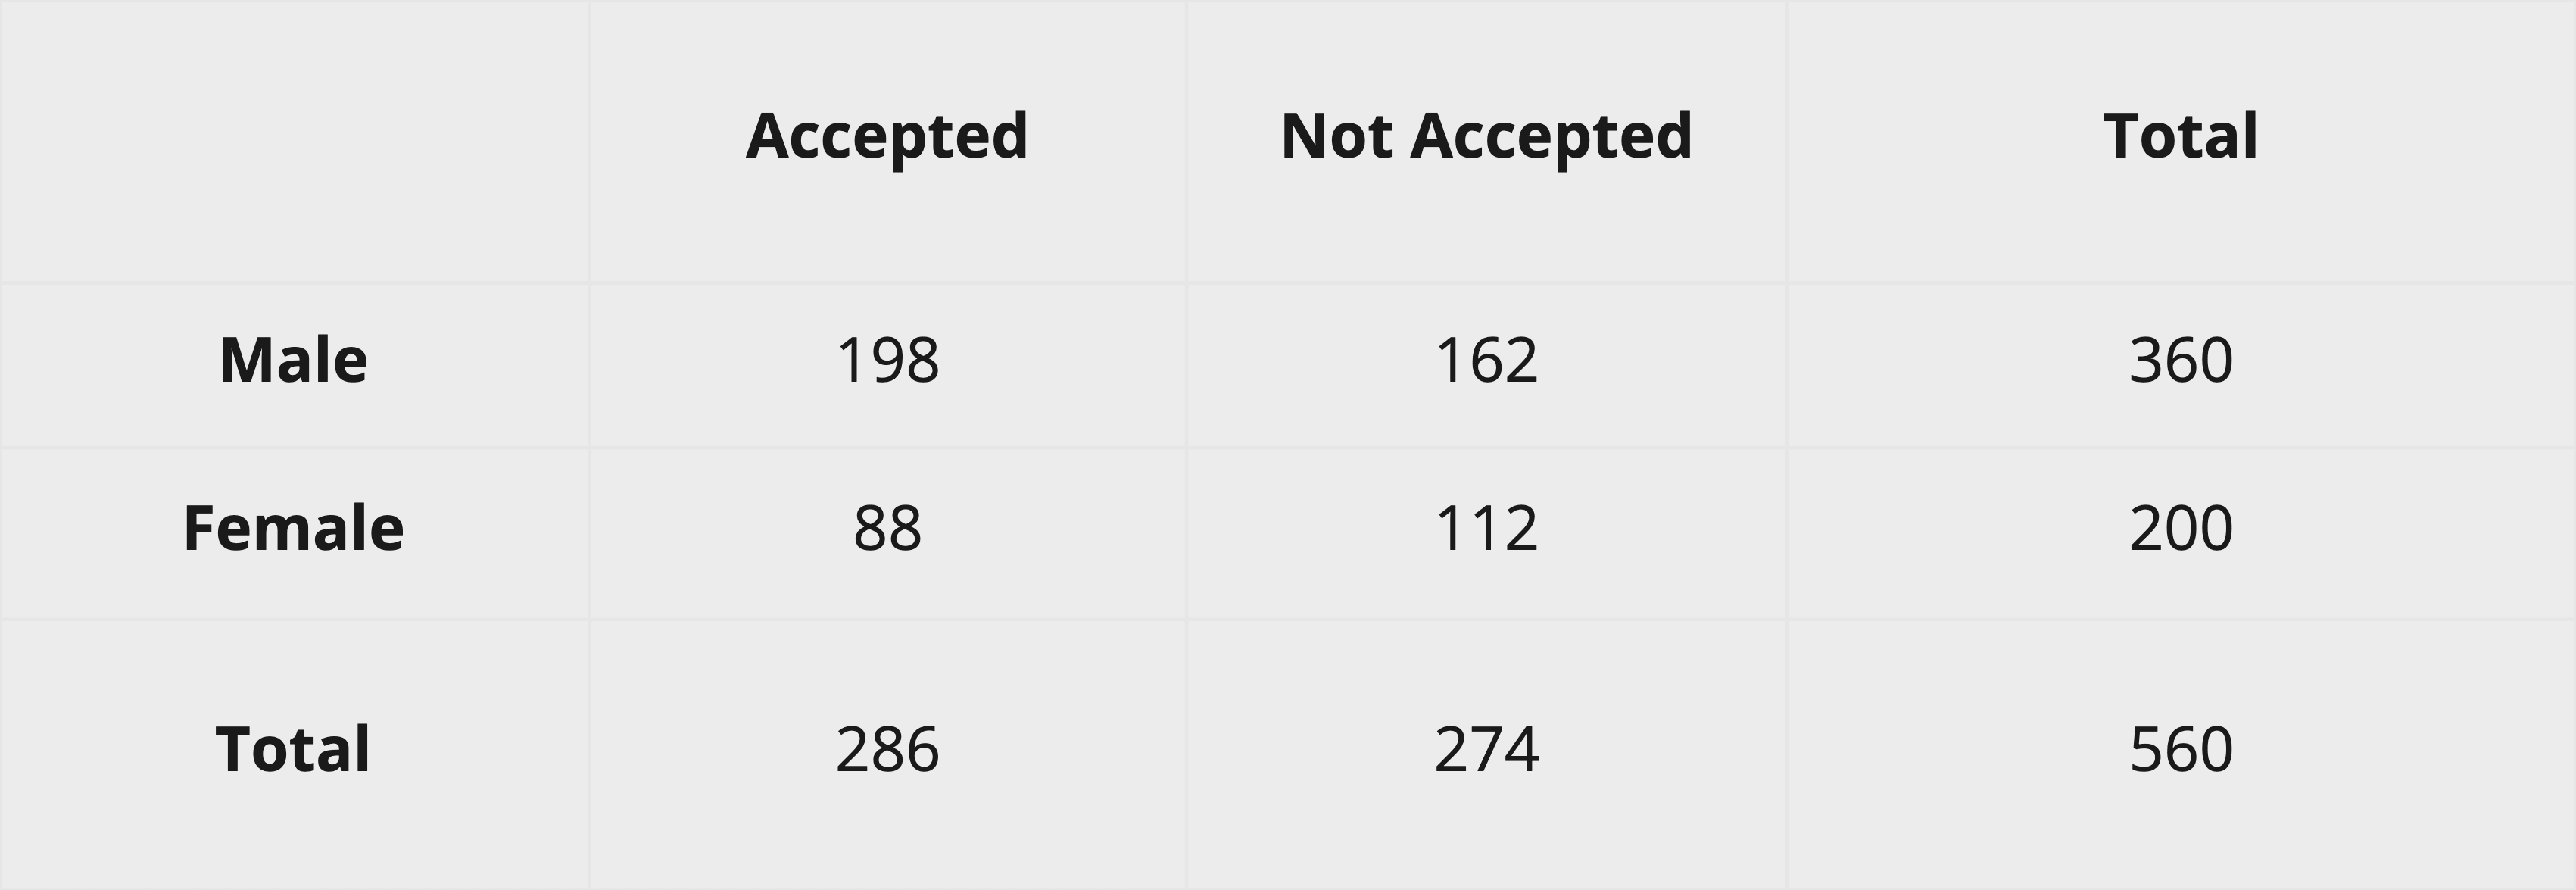
Gender bias?
\(\hat{P}_{males} = \frac{198}{360} = 0.55\)
\(\hat{P}_{females} = \frac{88}{200} = 0.44\)
Conclude: positive association between “maleness” and acceptance
Gender bias?
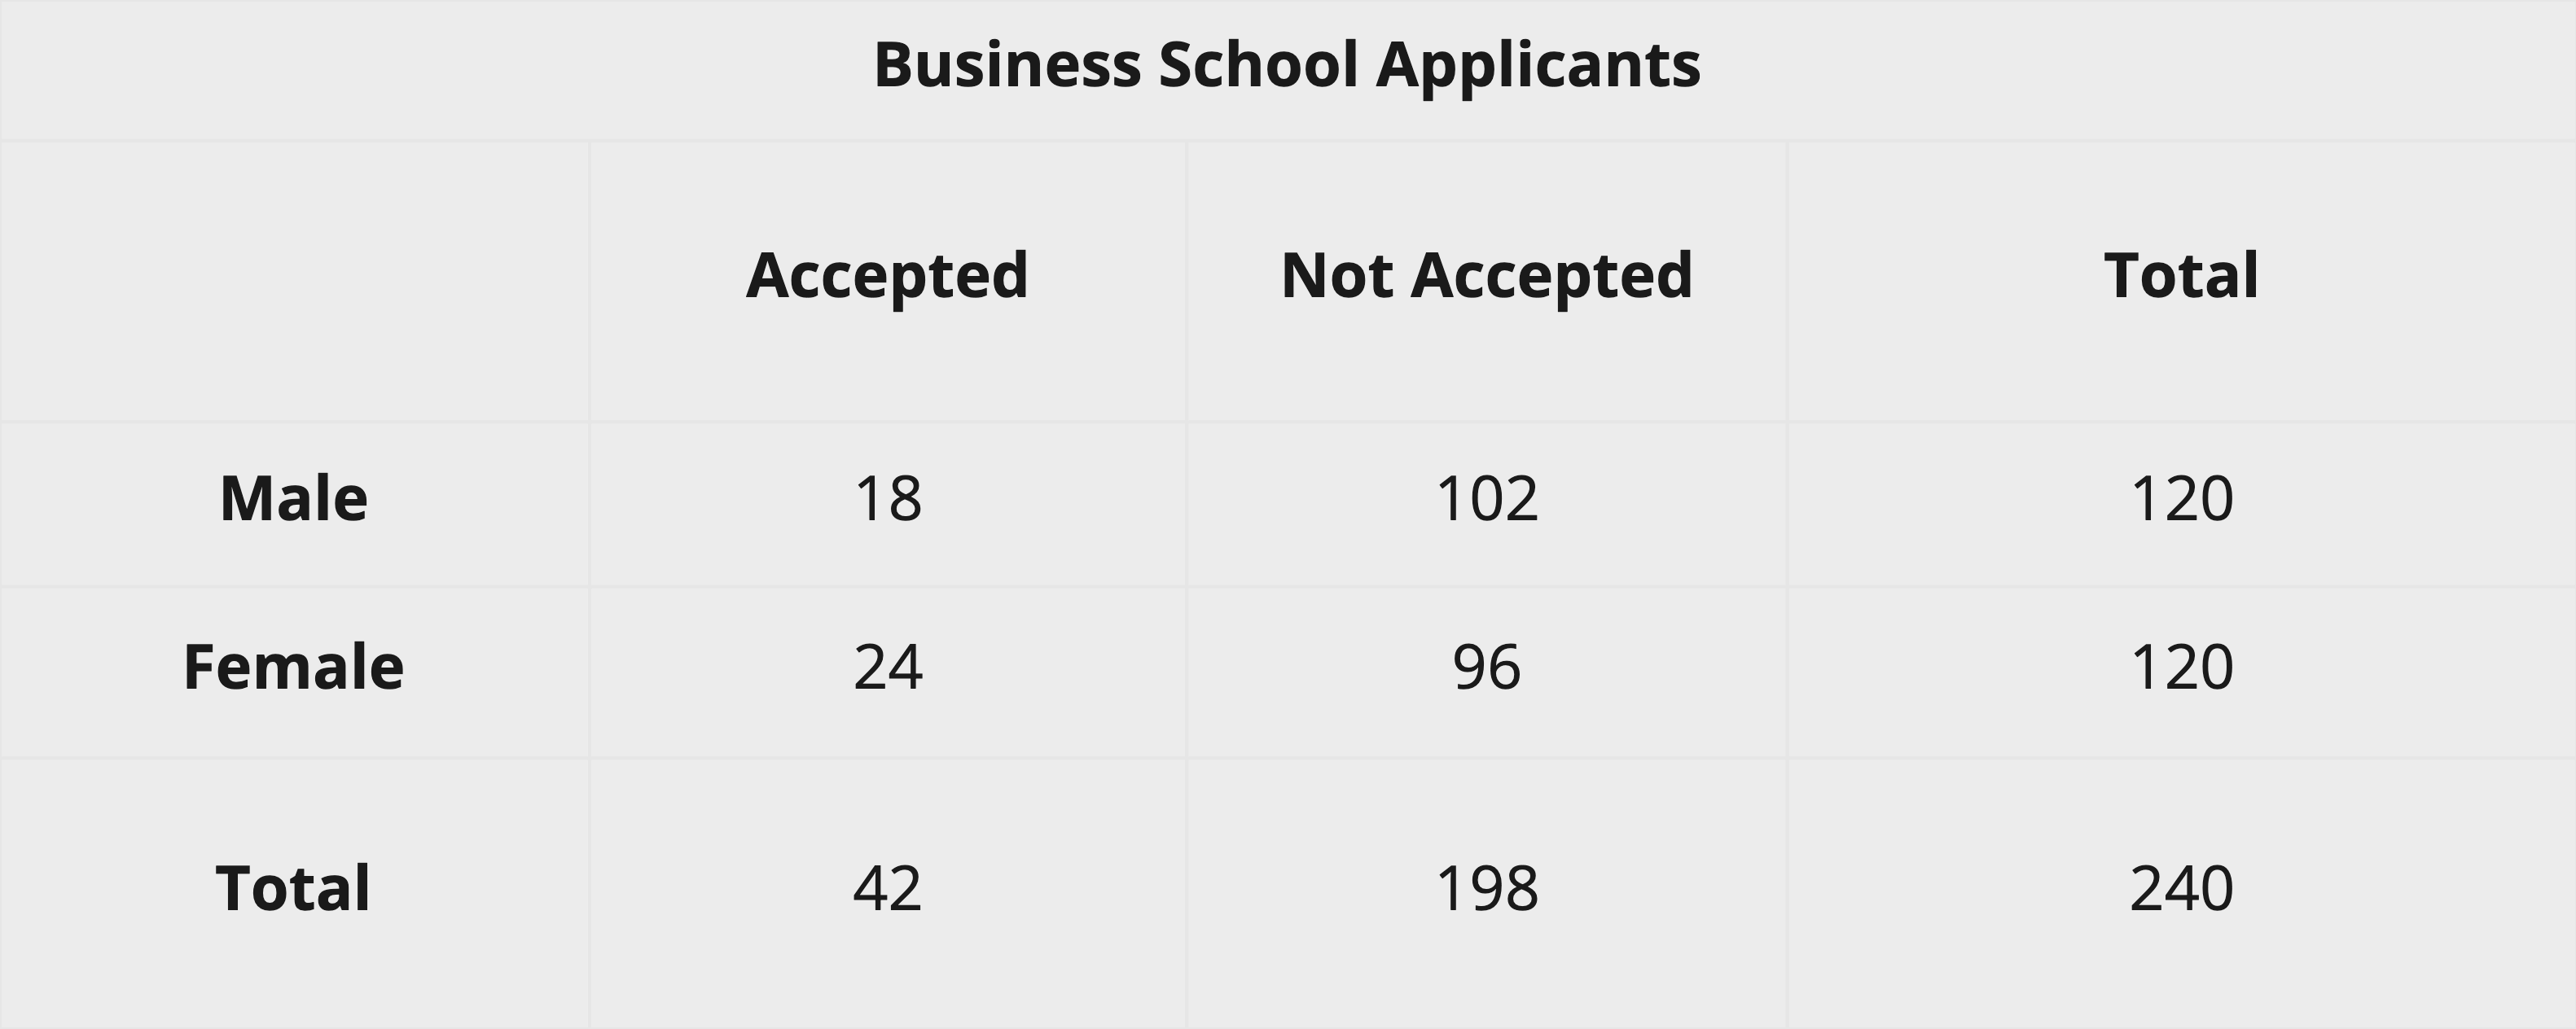
Business school
\(\hat{P}_{males} = \frac{18}{120} = 0.15\)
\(\hat{P}_{females} = \frac{24}{120} = 0.20\)
Conclude: Negative association between “maleness” and acceptance
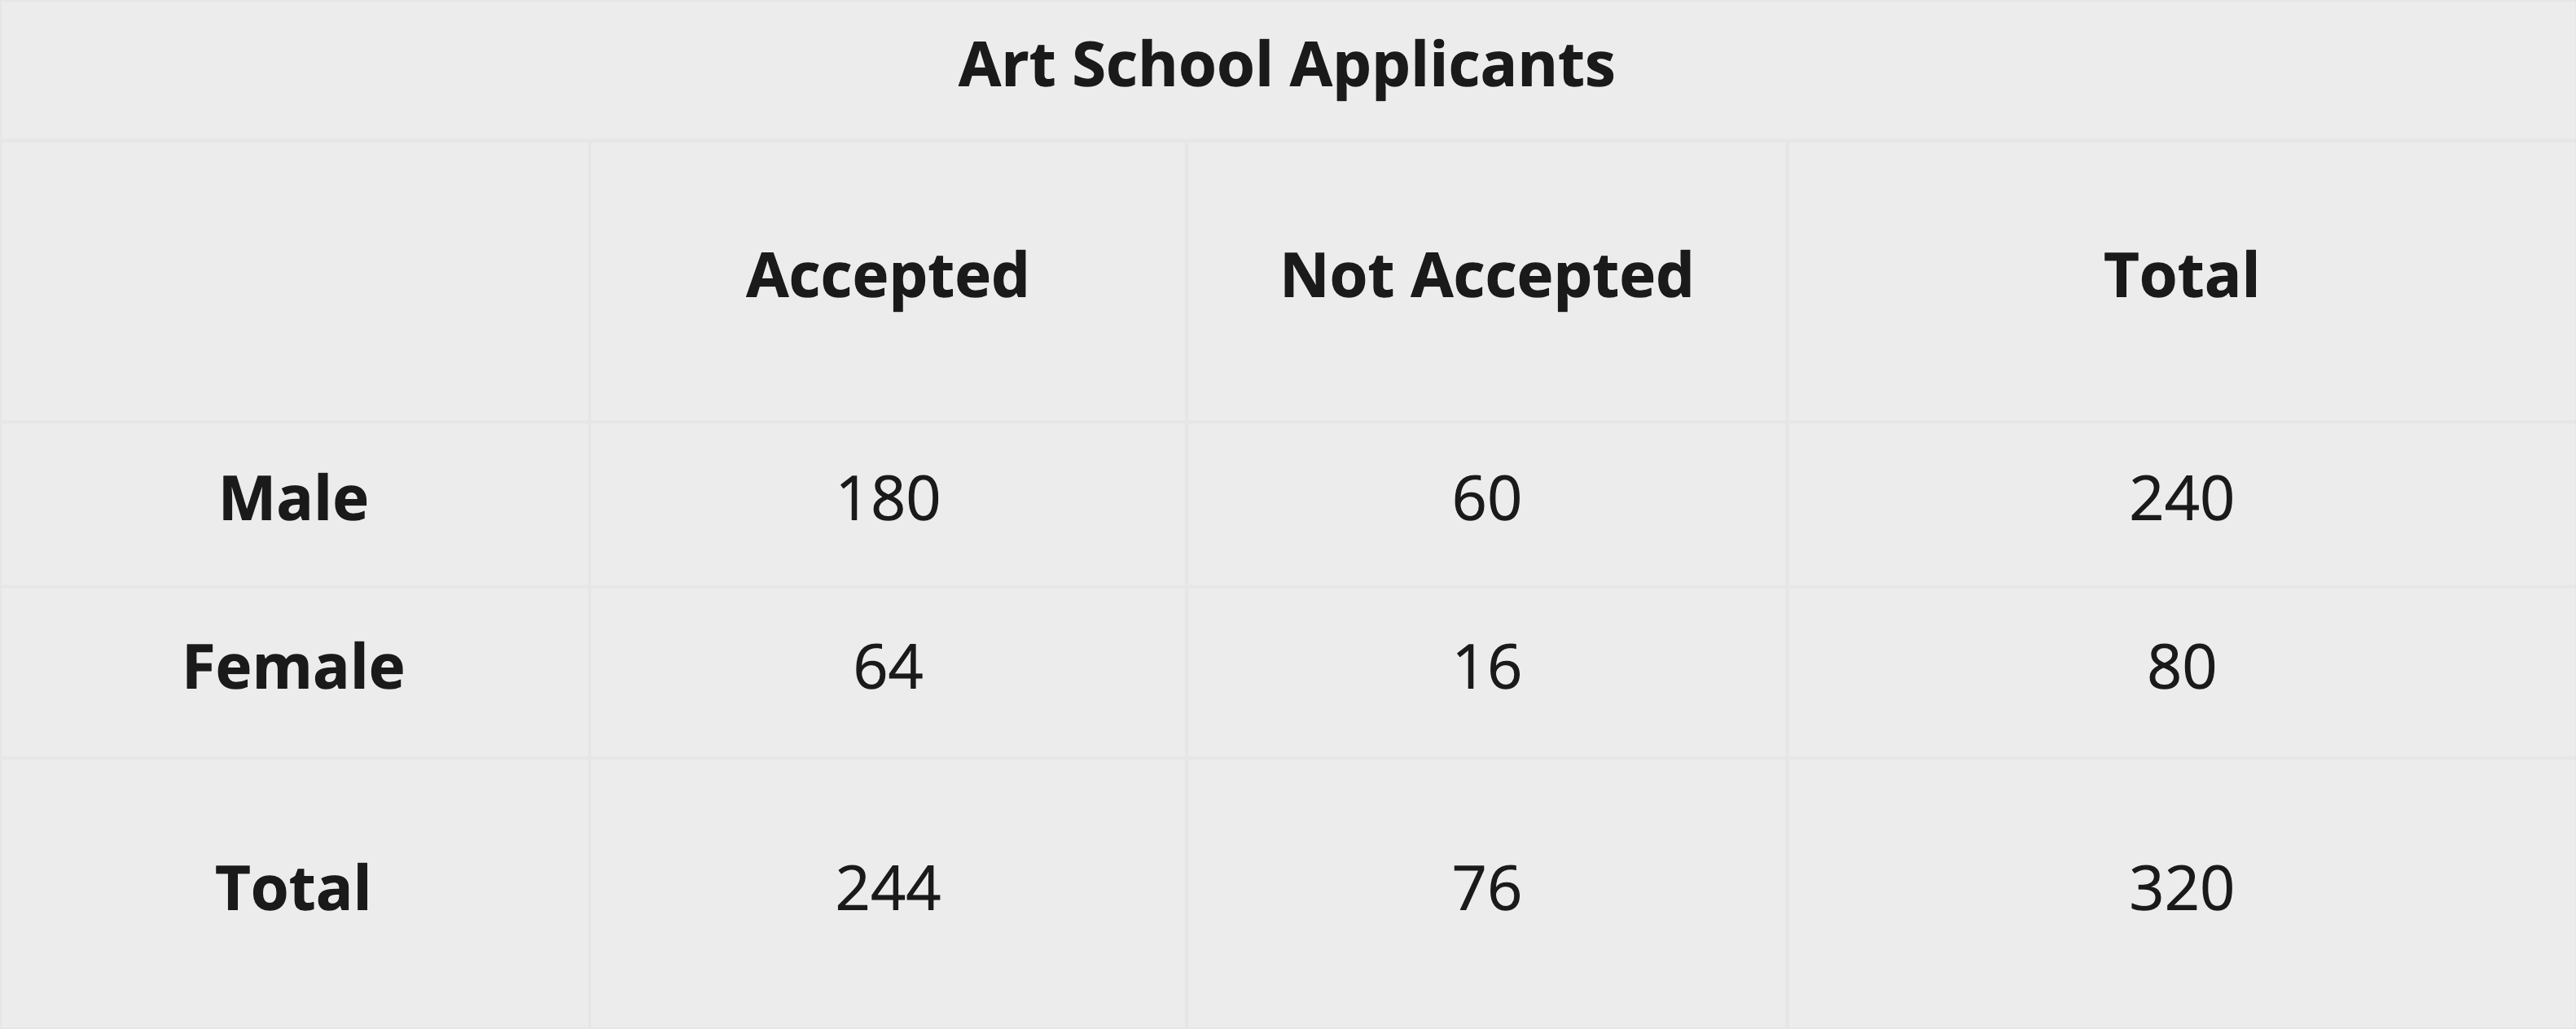
Art school
\(\hat{P}_{males} = \frac{180}{240} = 0.75\)
\(\hat{P}_{females} = \frac{64}{80} = 0.80\)
Conclude: Negative association between “maleness” and acceptance
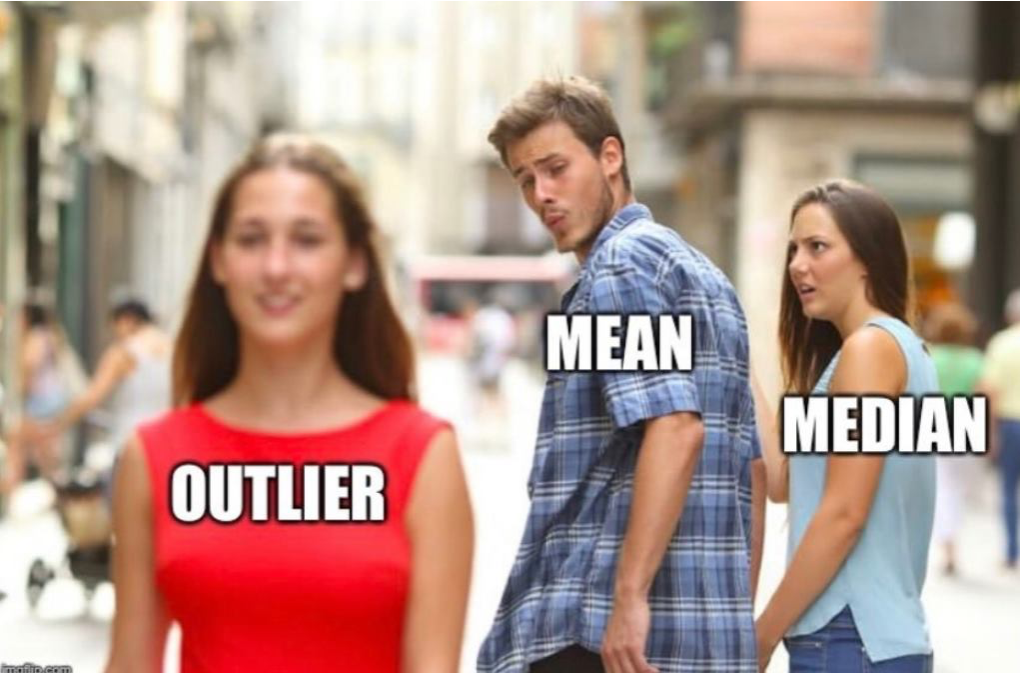
Mean, Median, and Mode
Average wealth of people in a room
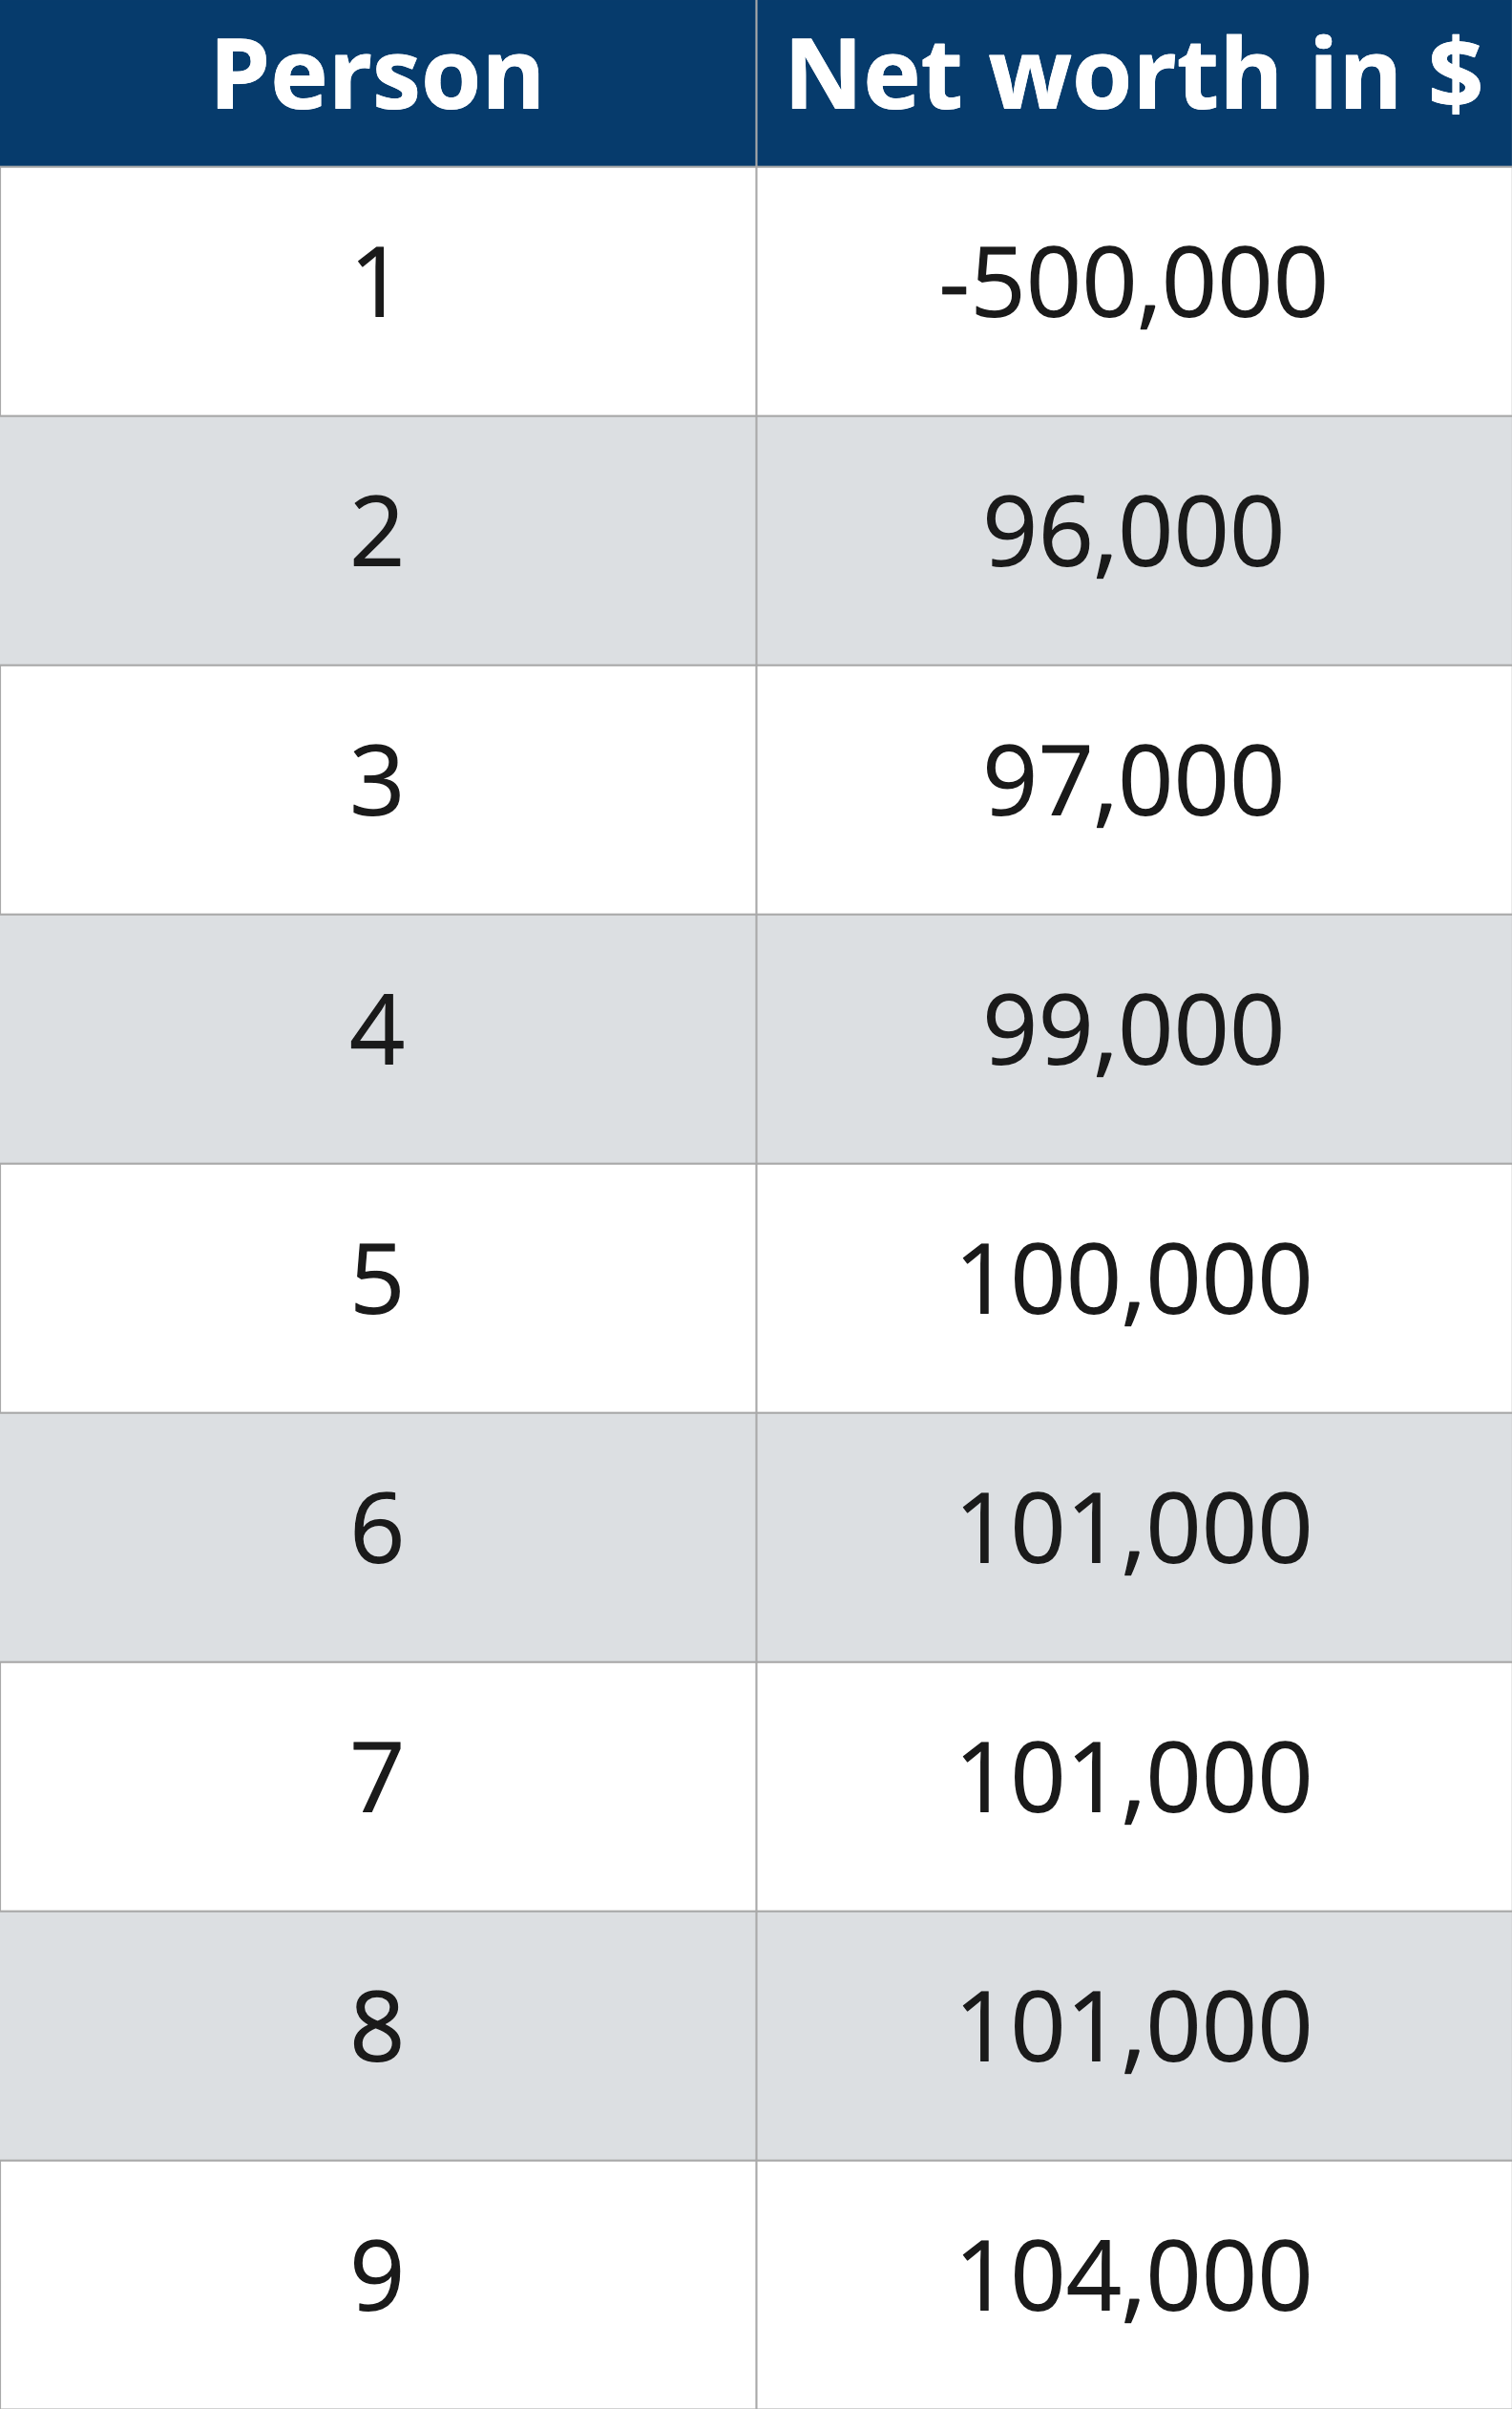
- Mean = $33,222
- Median = $100,000
- Mode = $101,000
Bimodal distribution

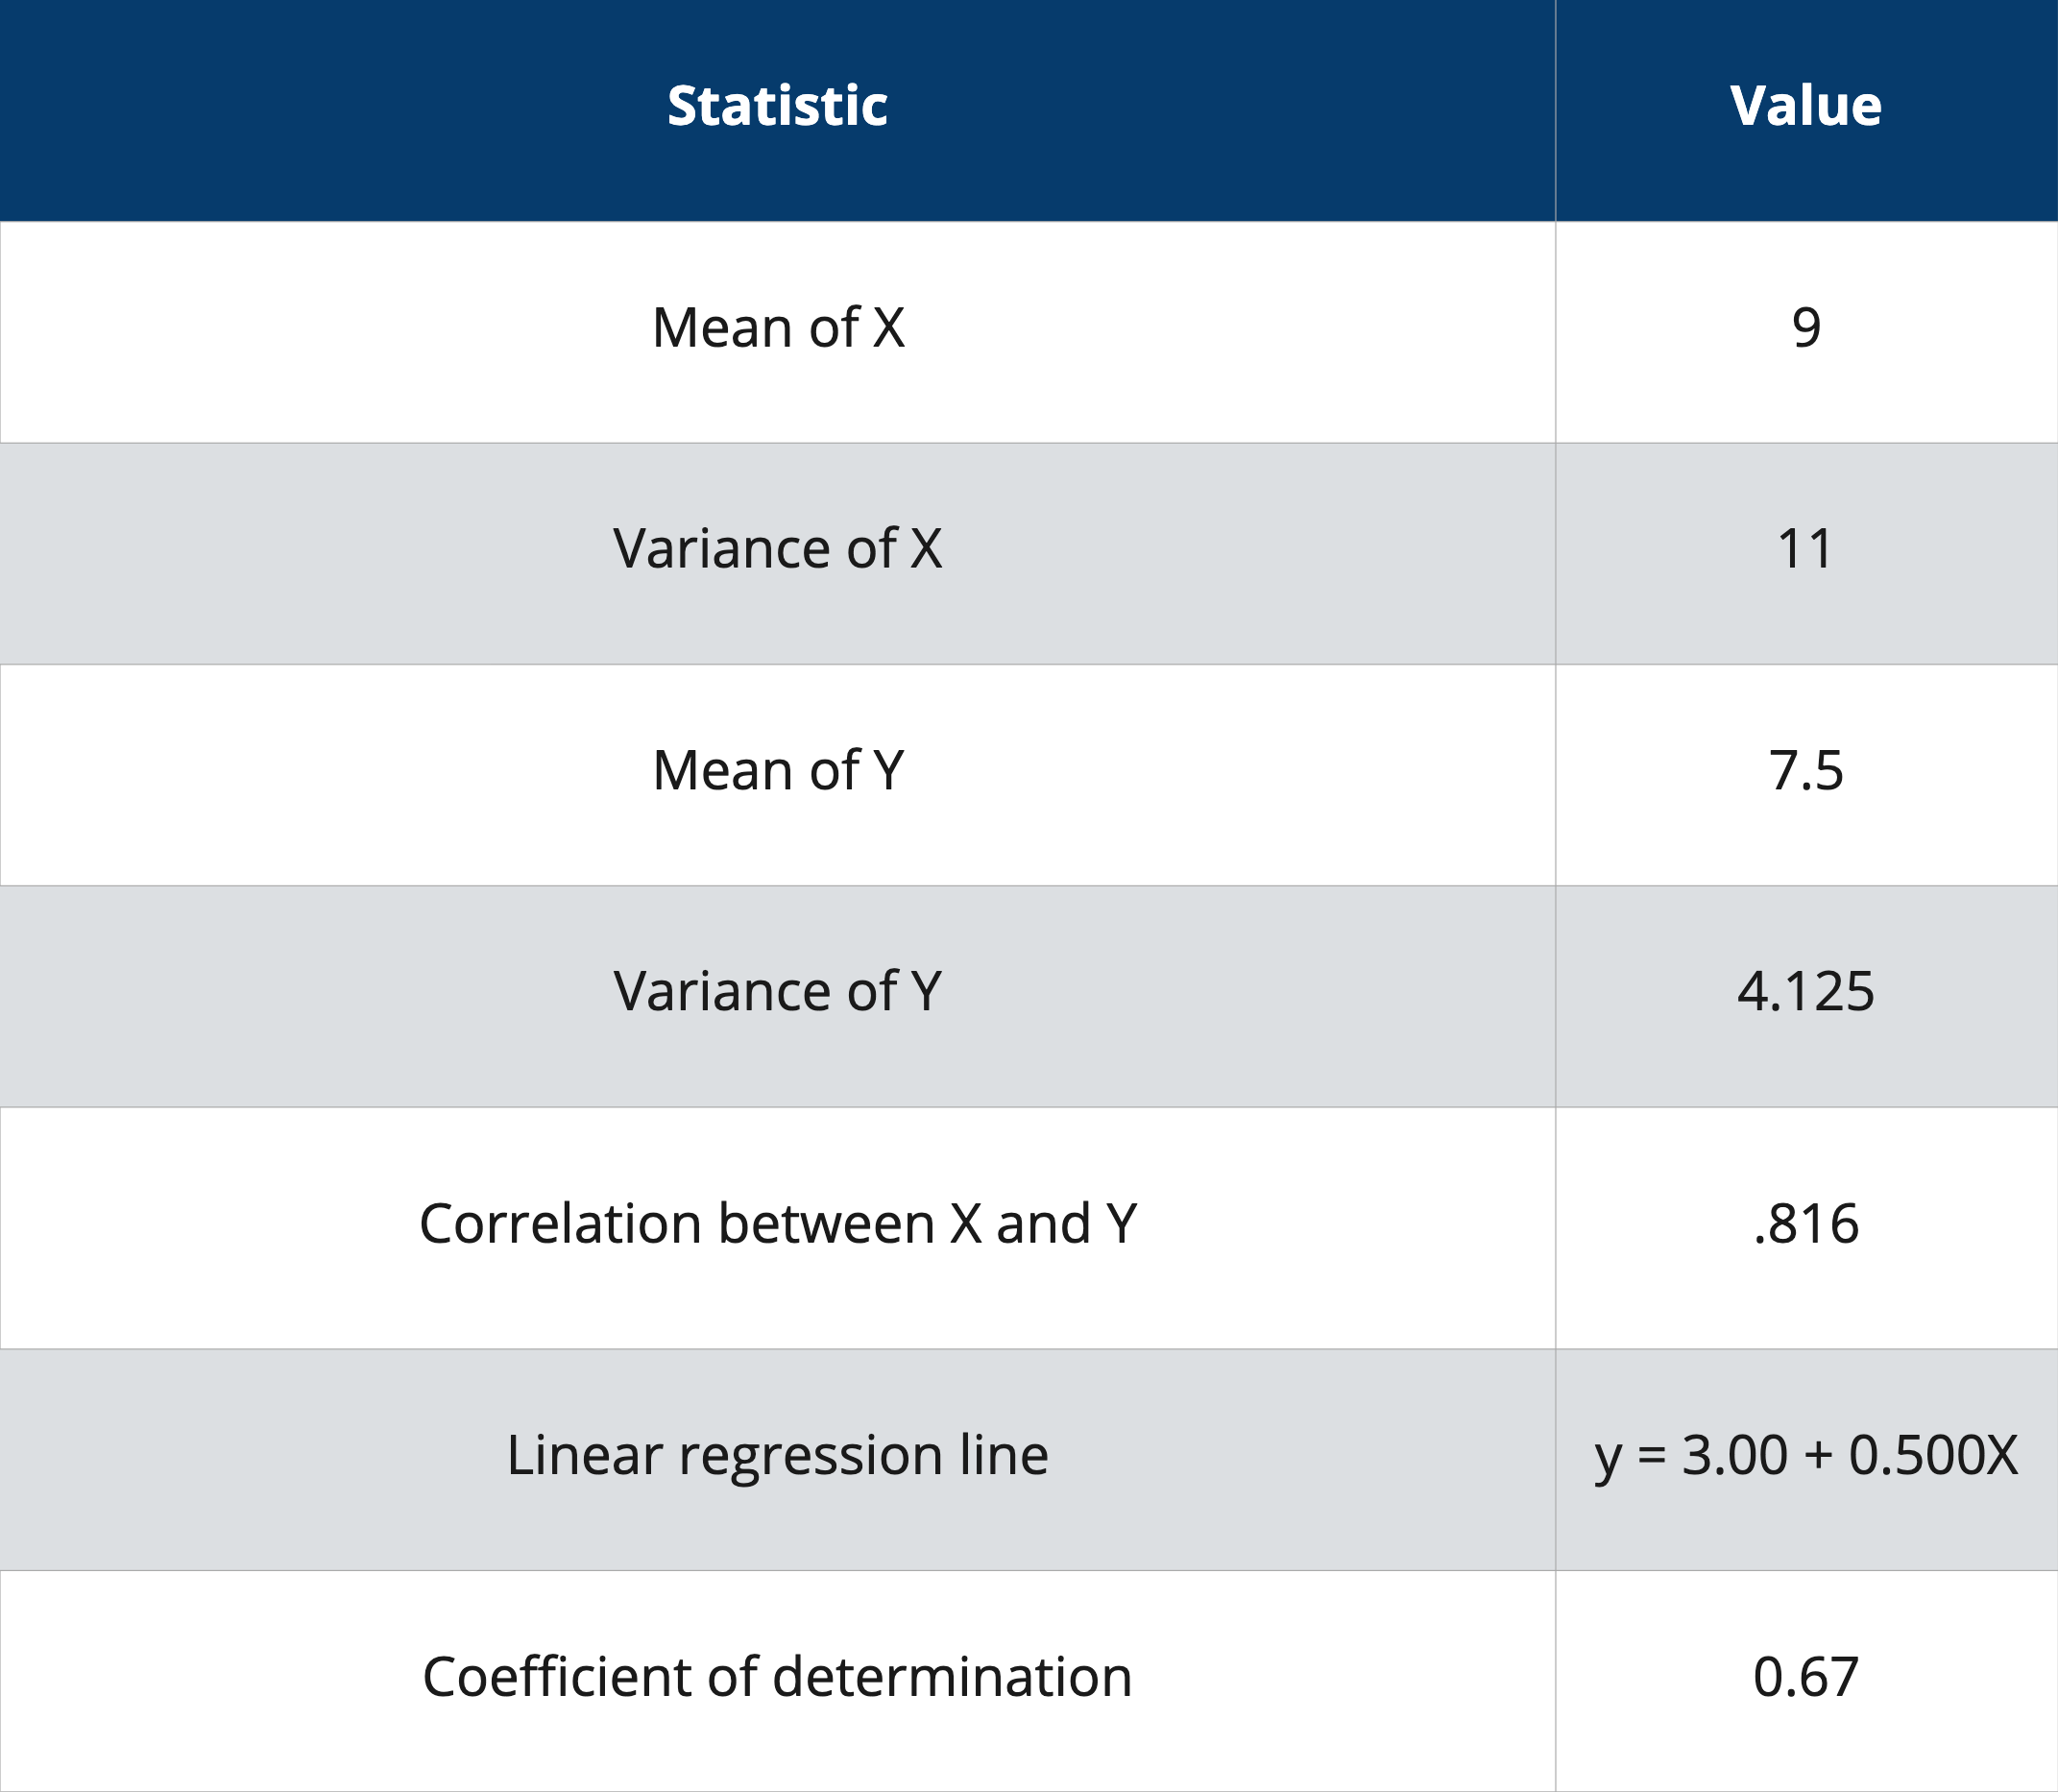
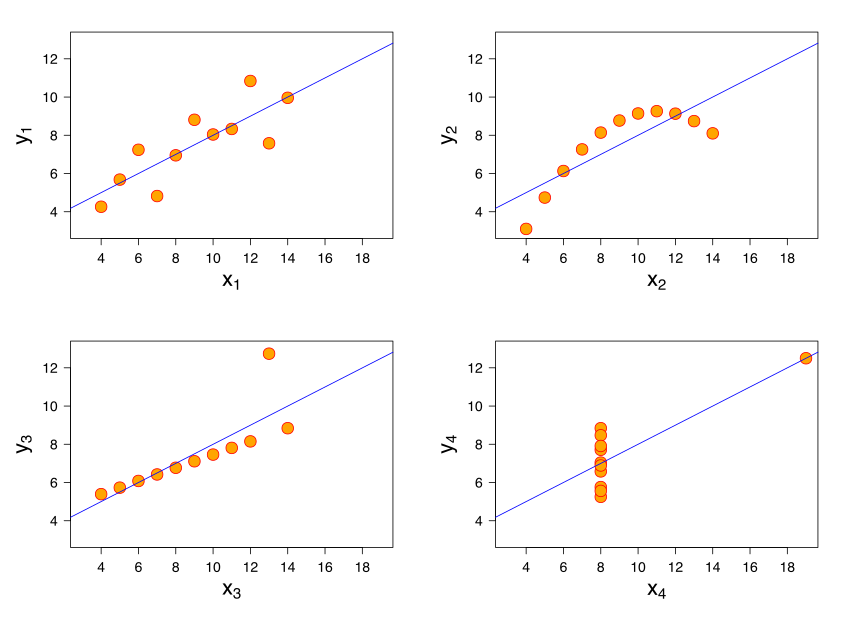
The Anscombe quartet
Four datasets with nearly identical descriptive statistics
Data presentation: Table vs. Graph
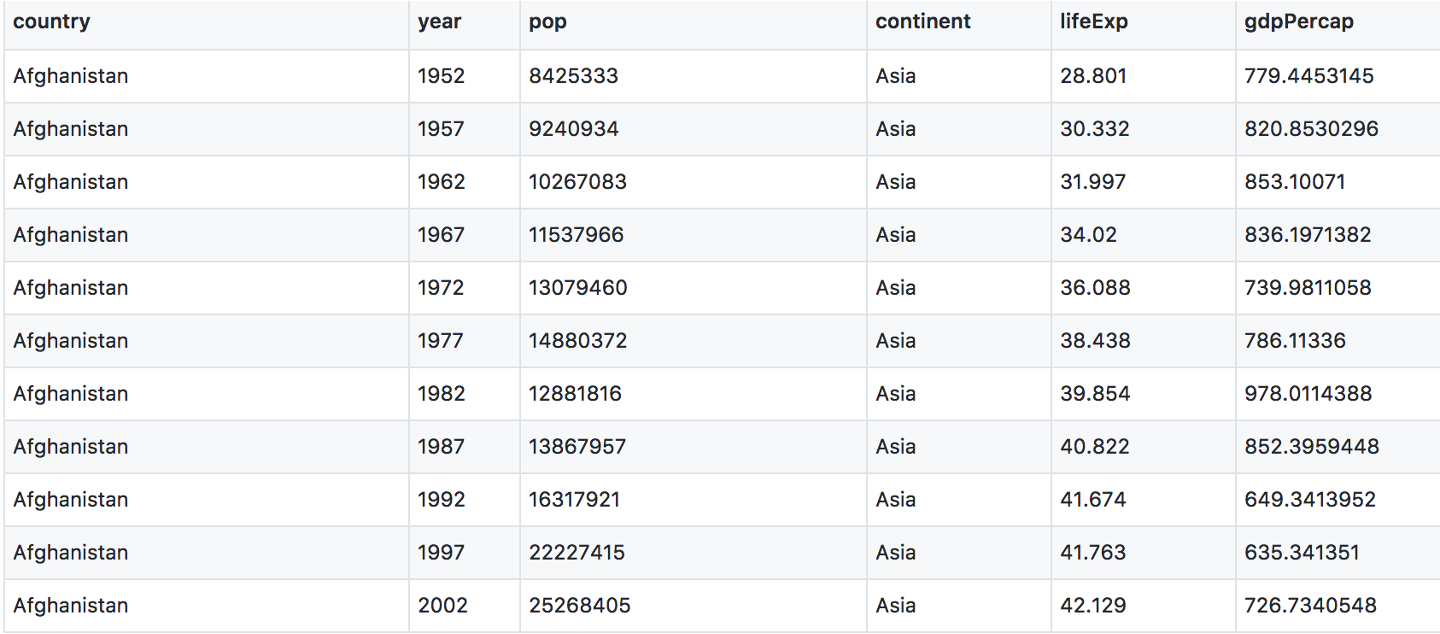
Graphical presentation
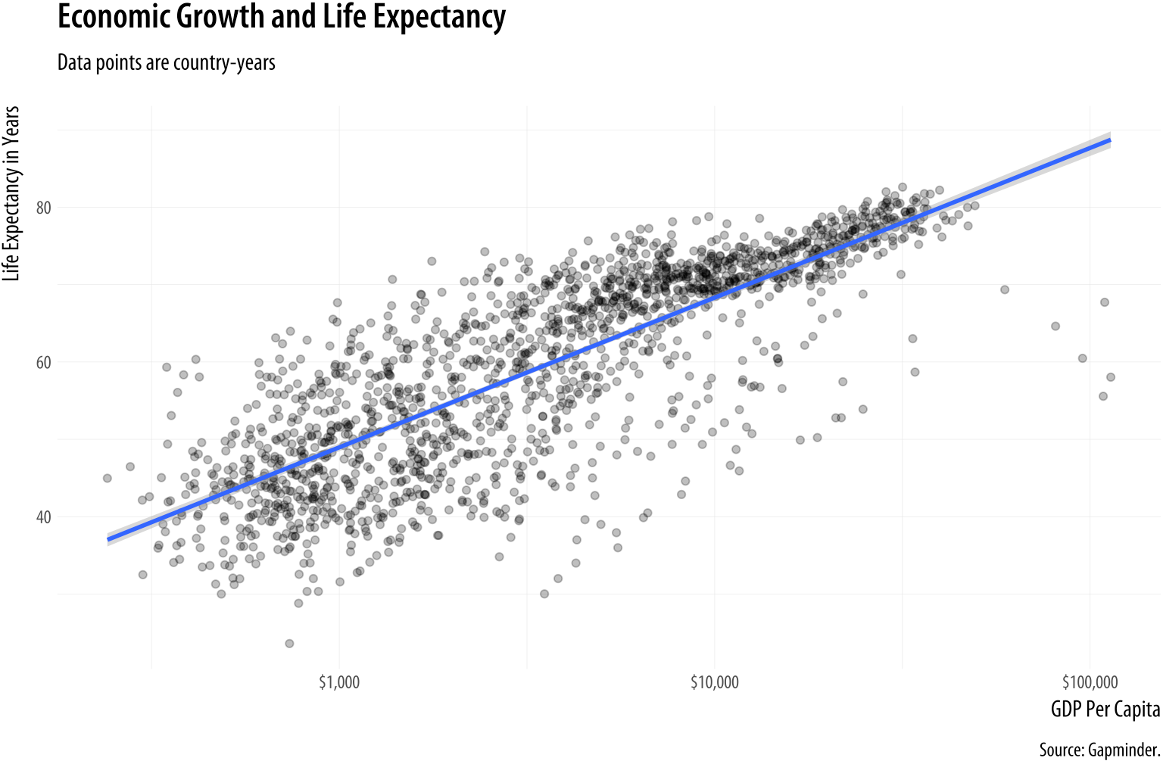
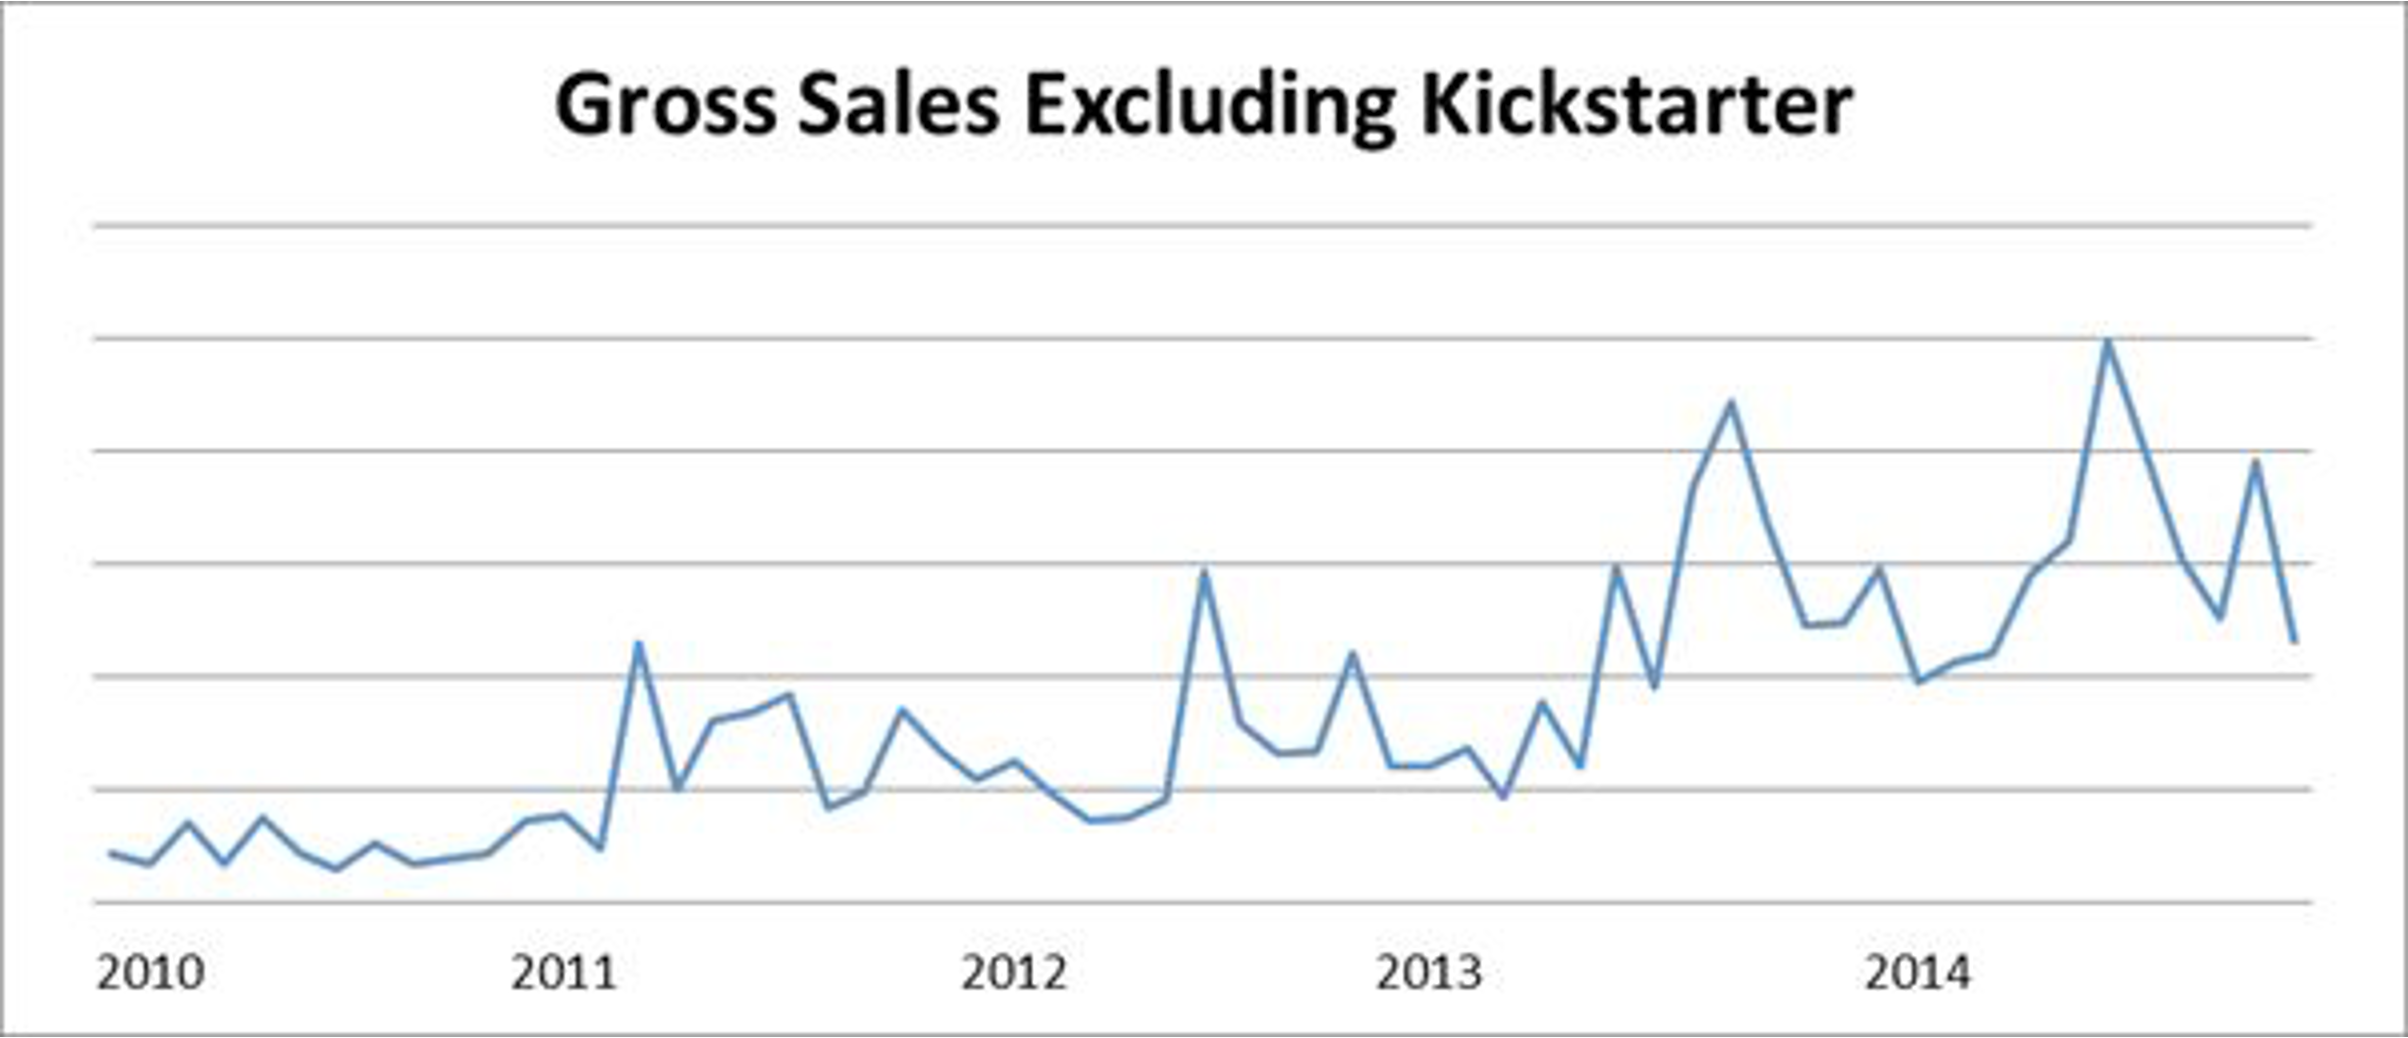
Unlabeled axes
Truncated vertical axes
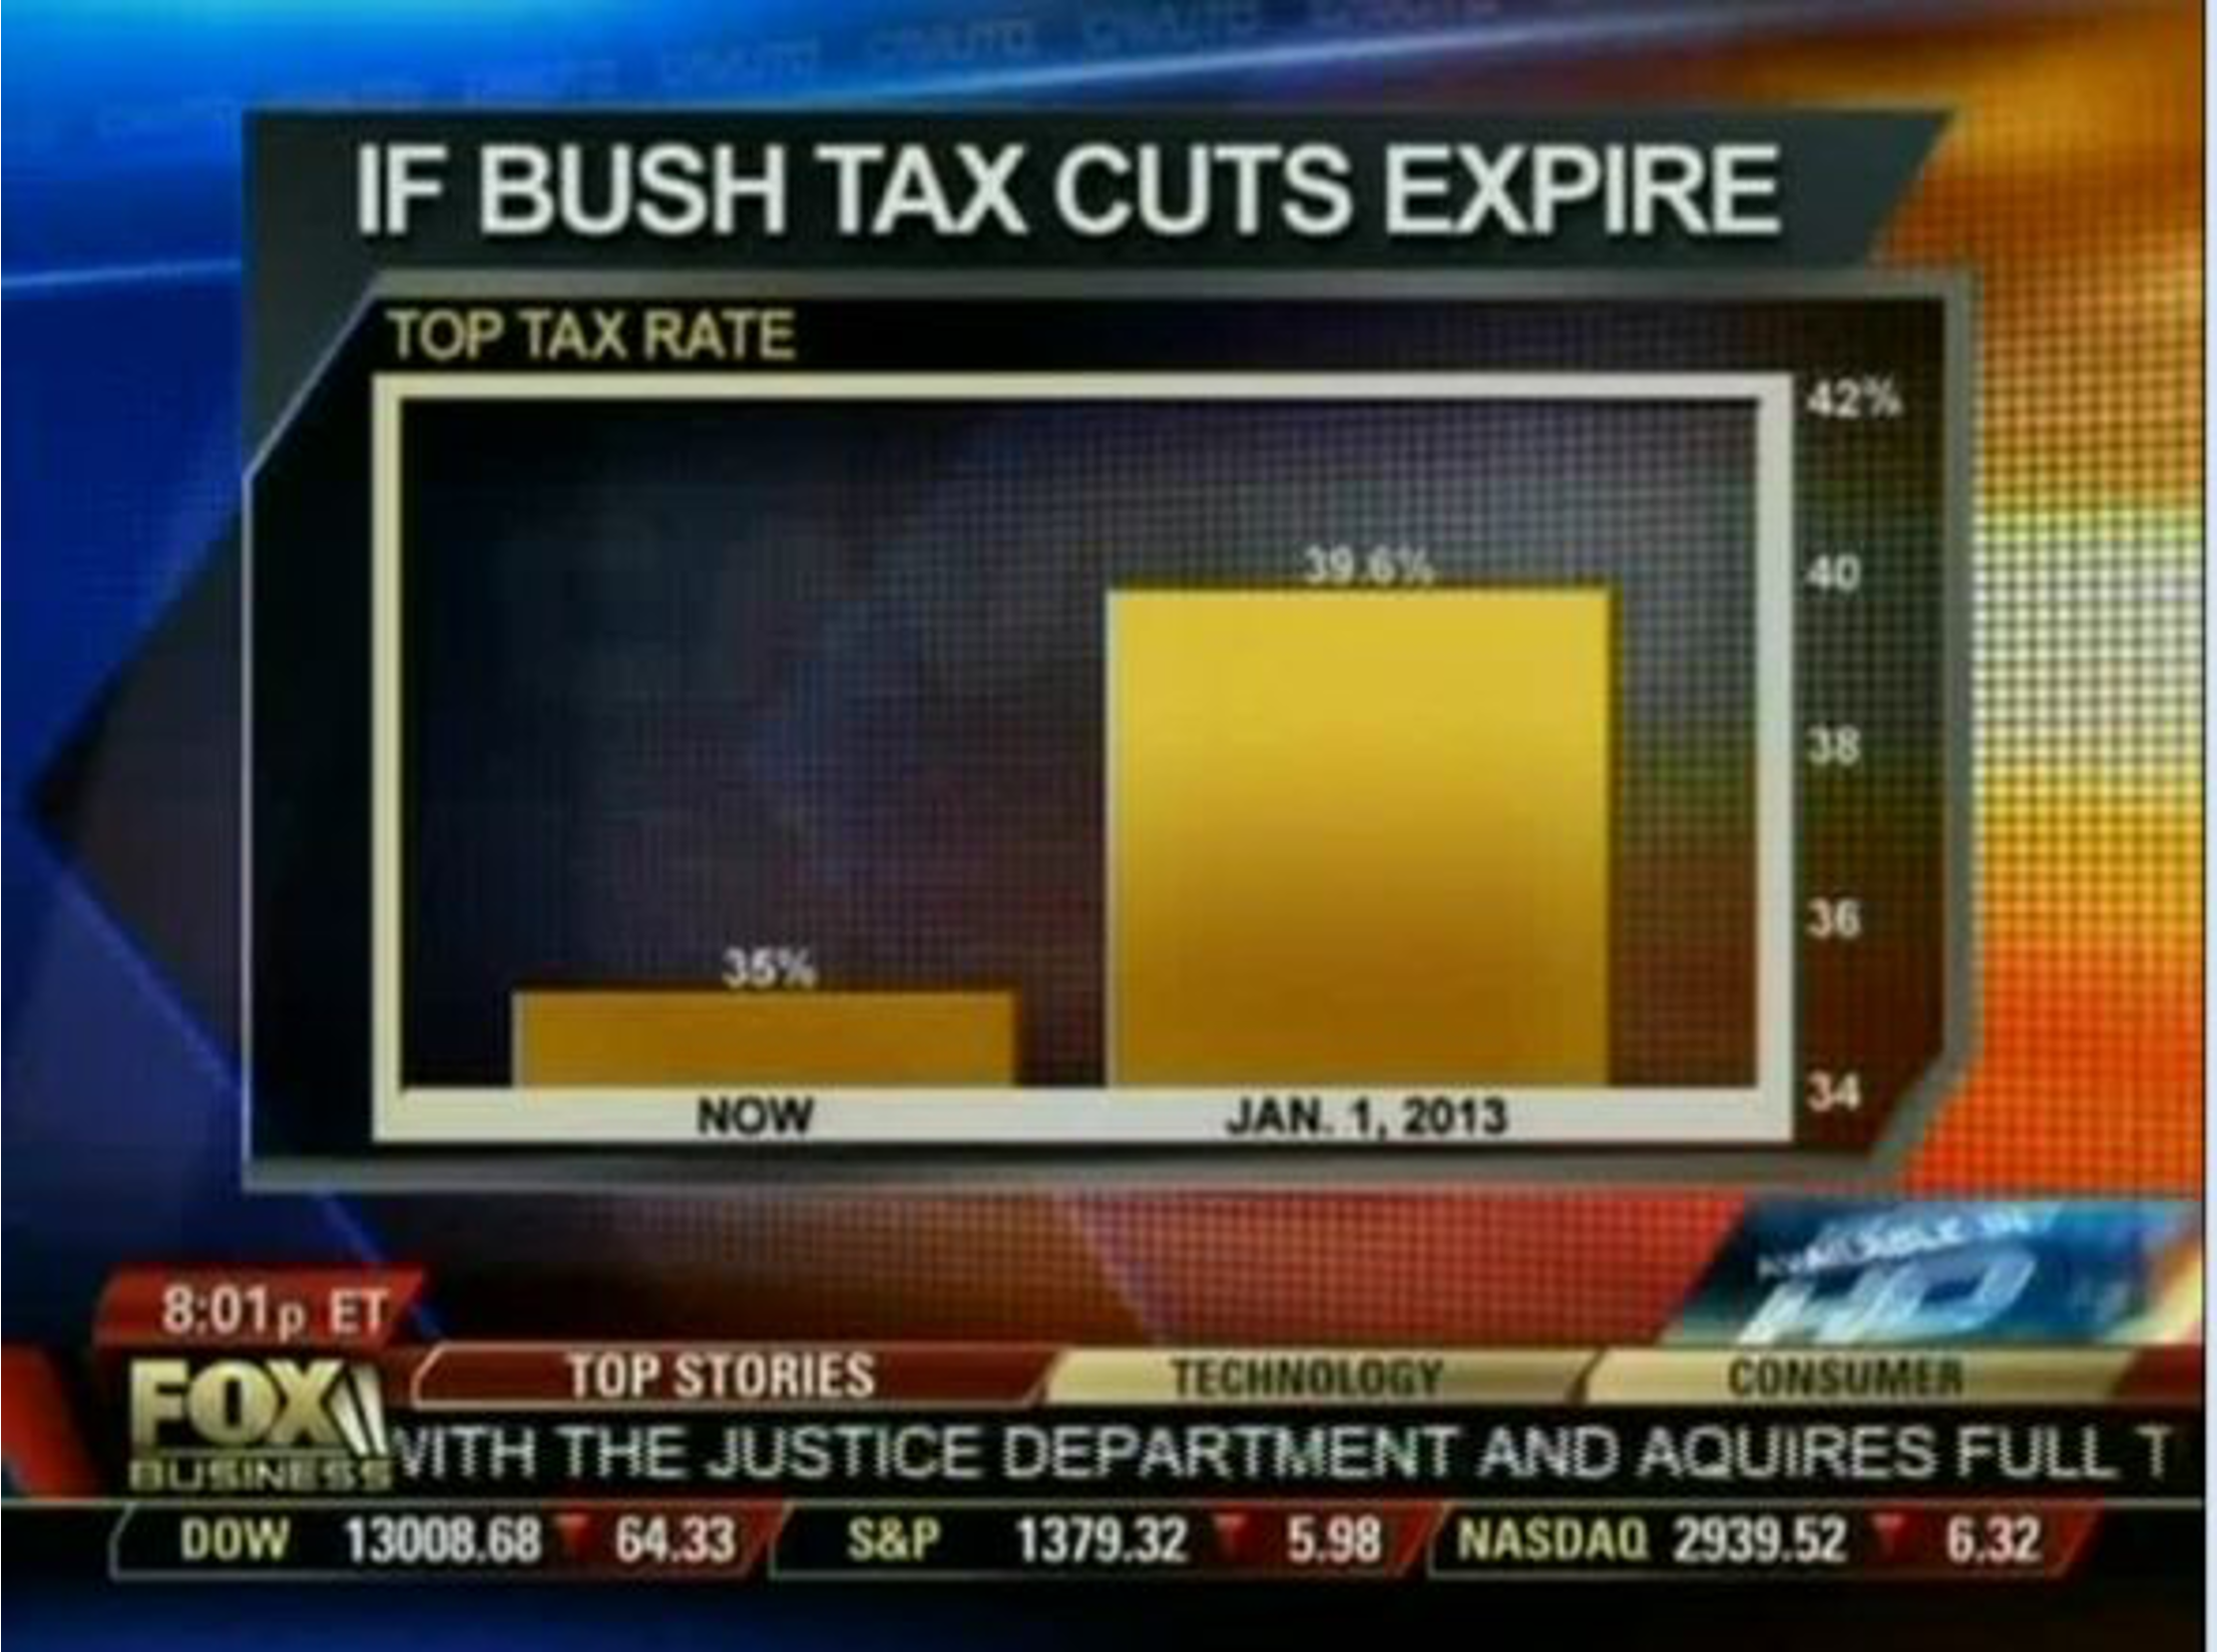
Truncated vertical axes
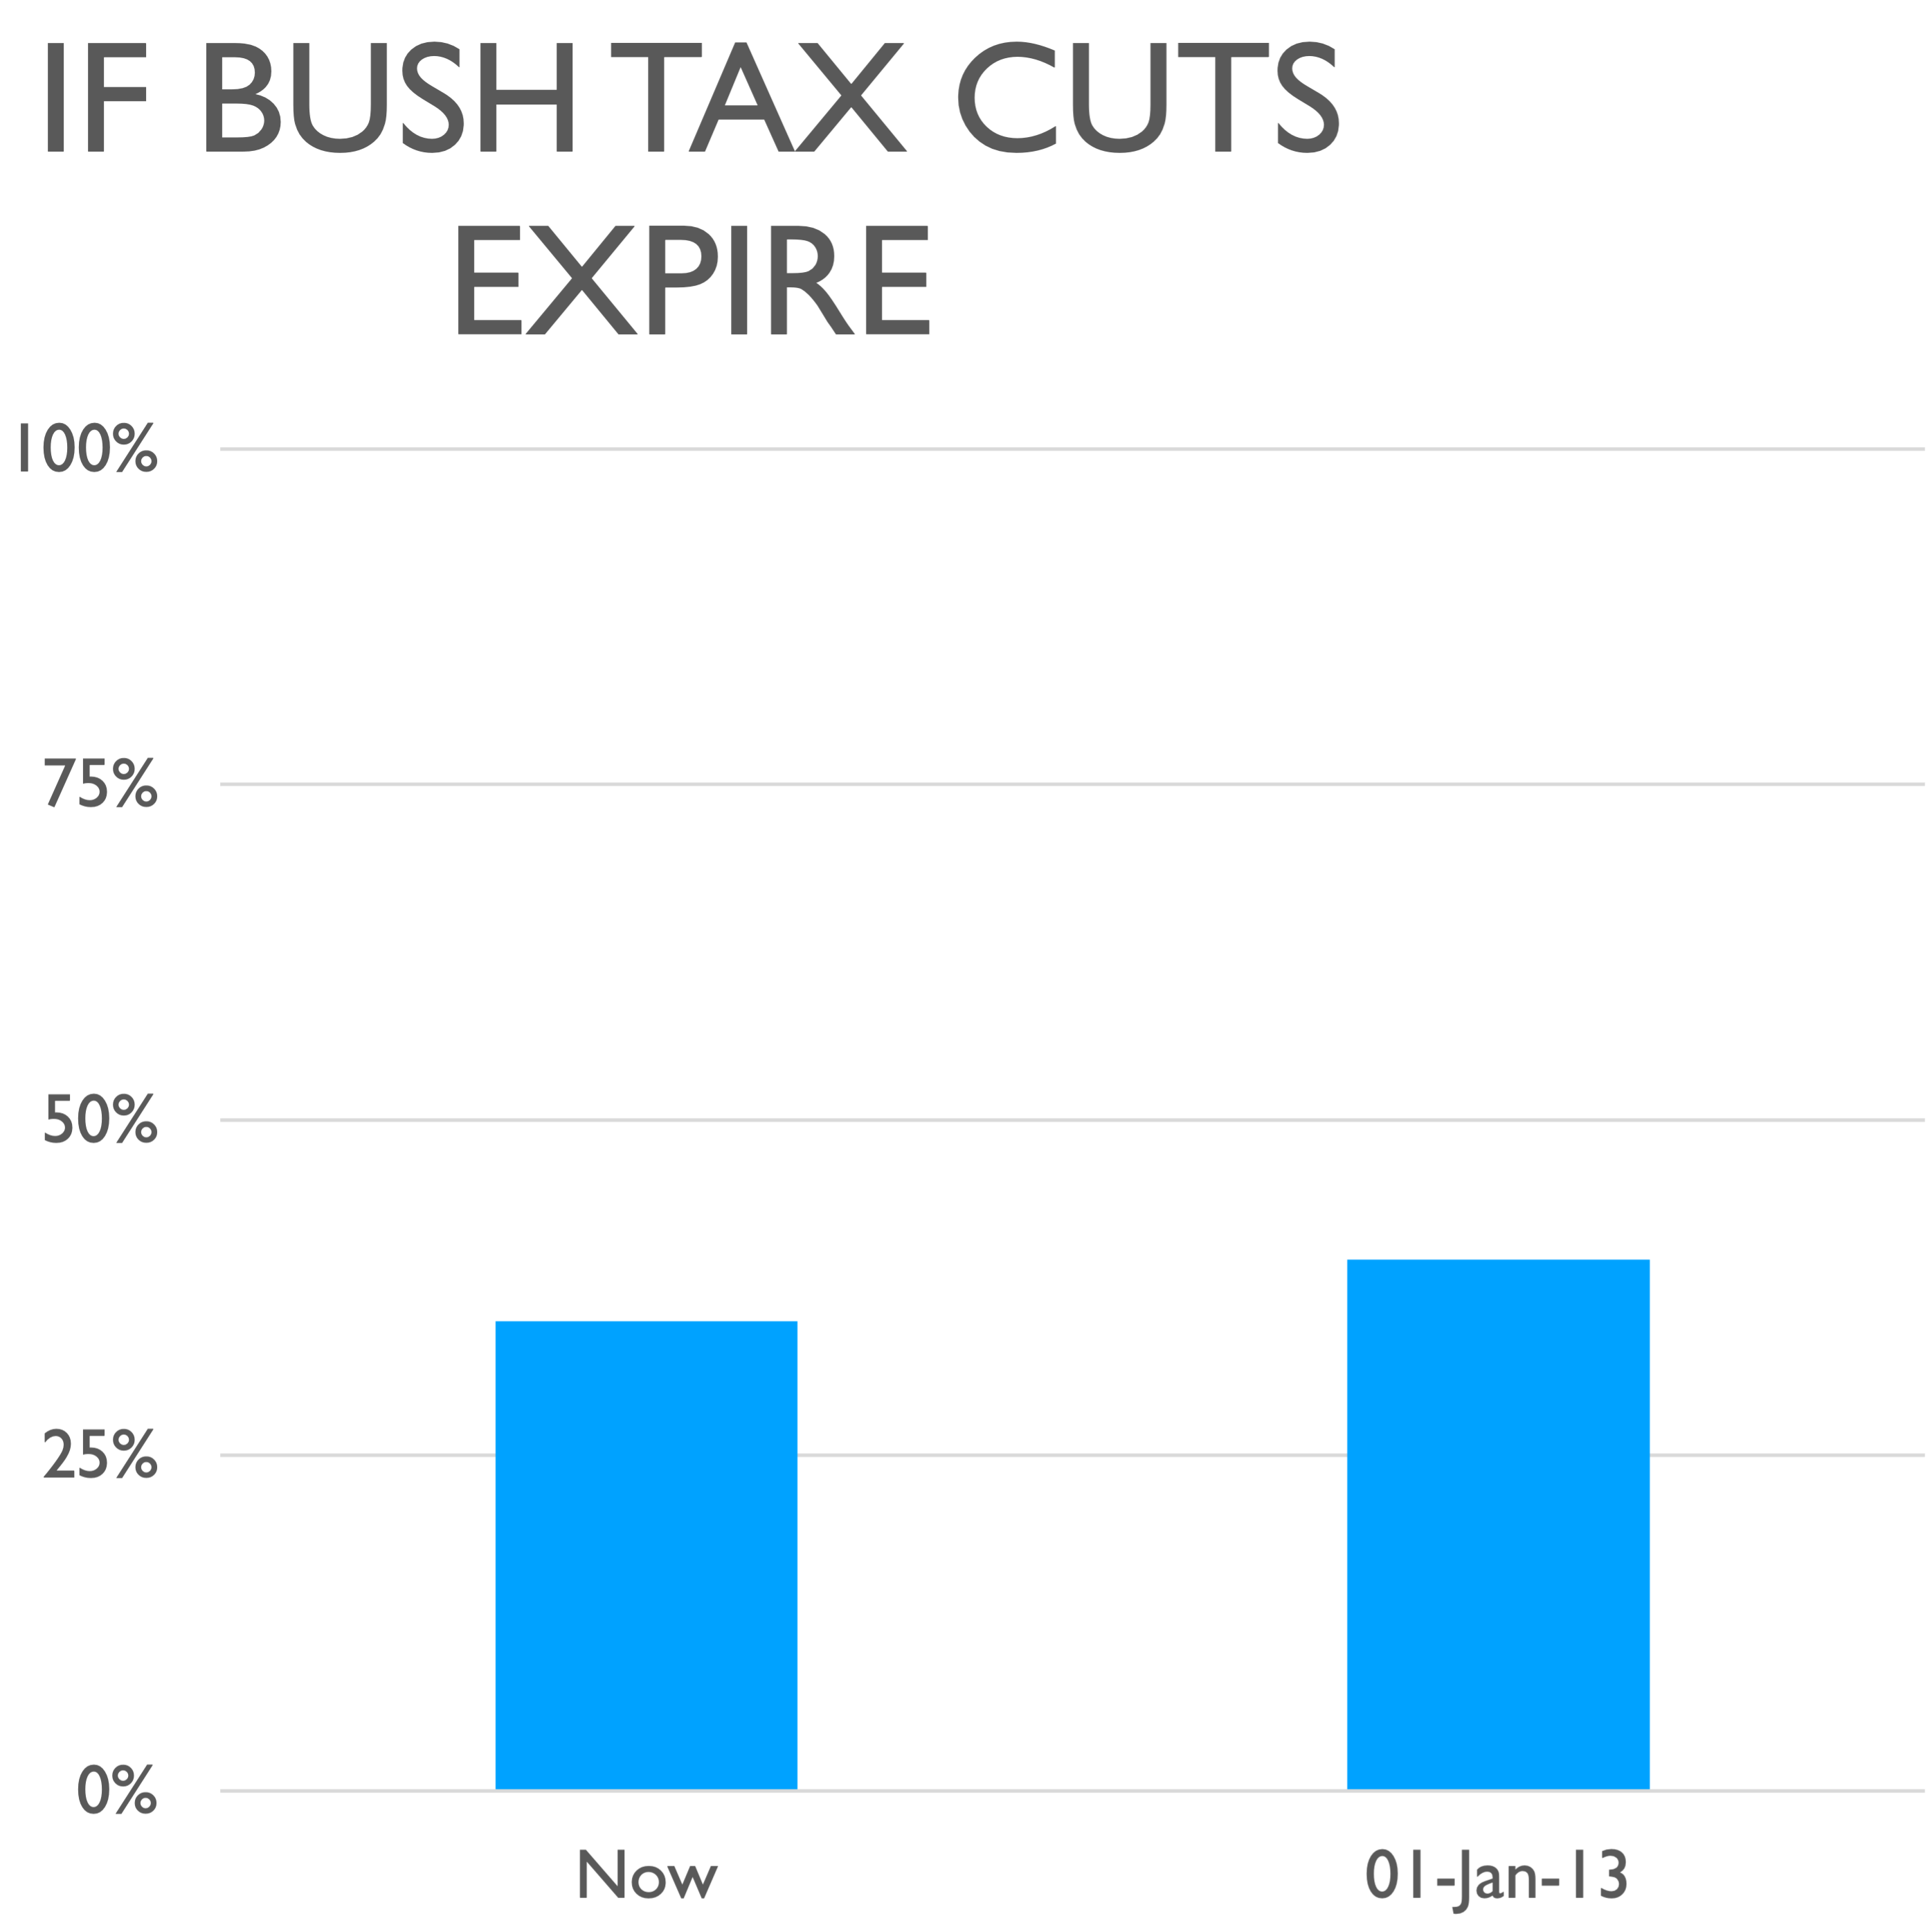
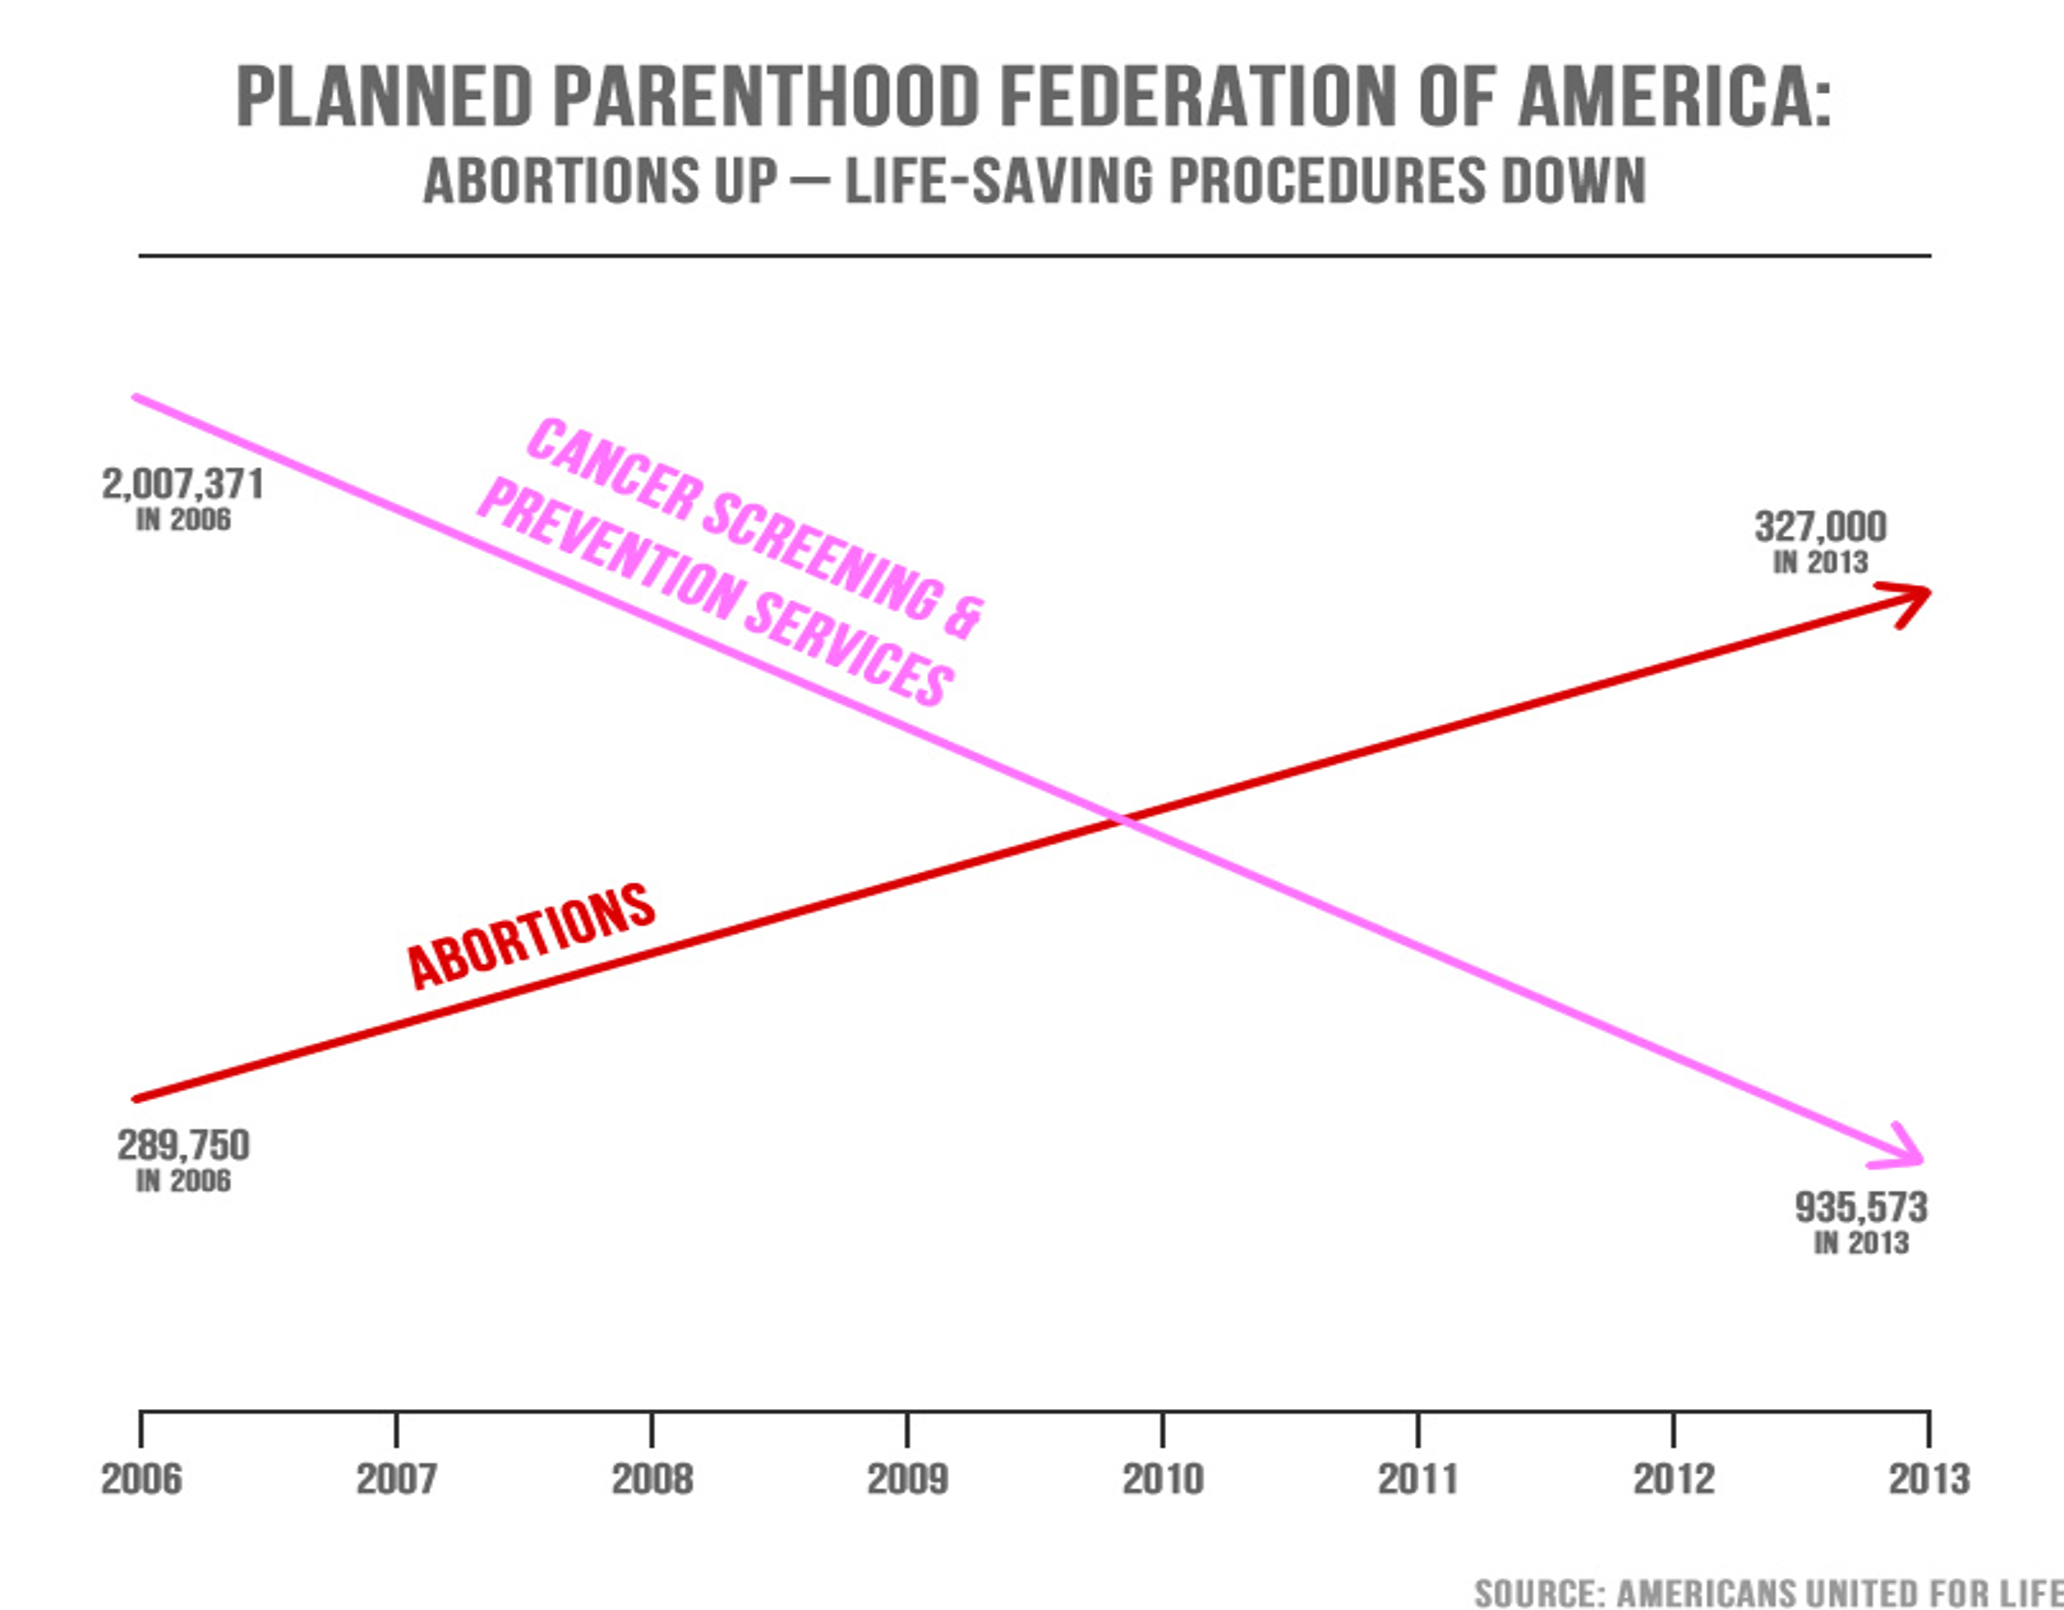
Misleading graph
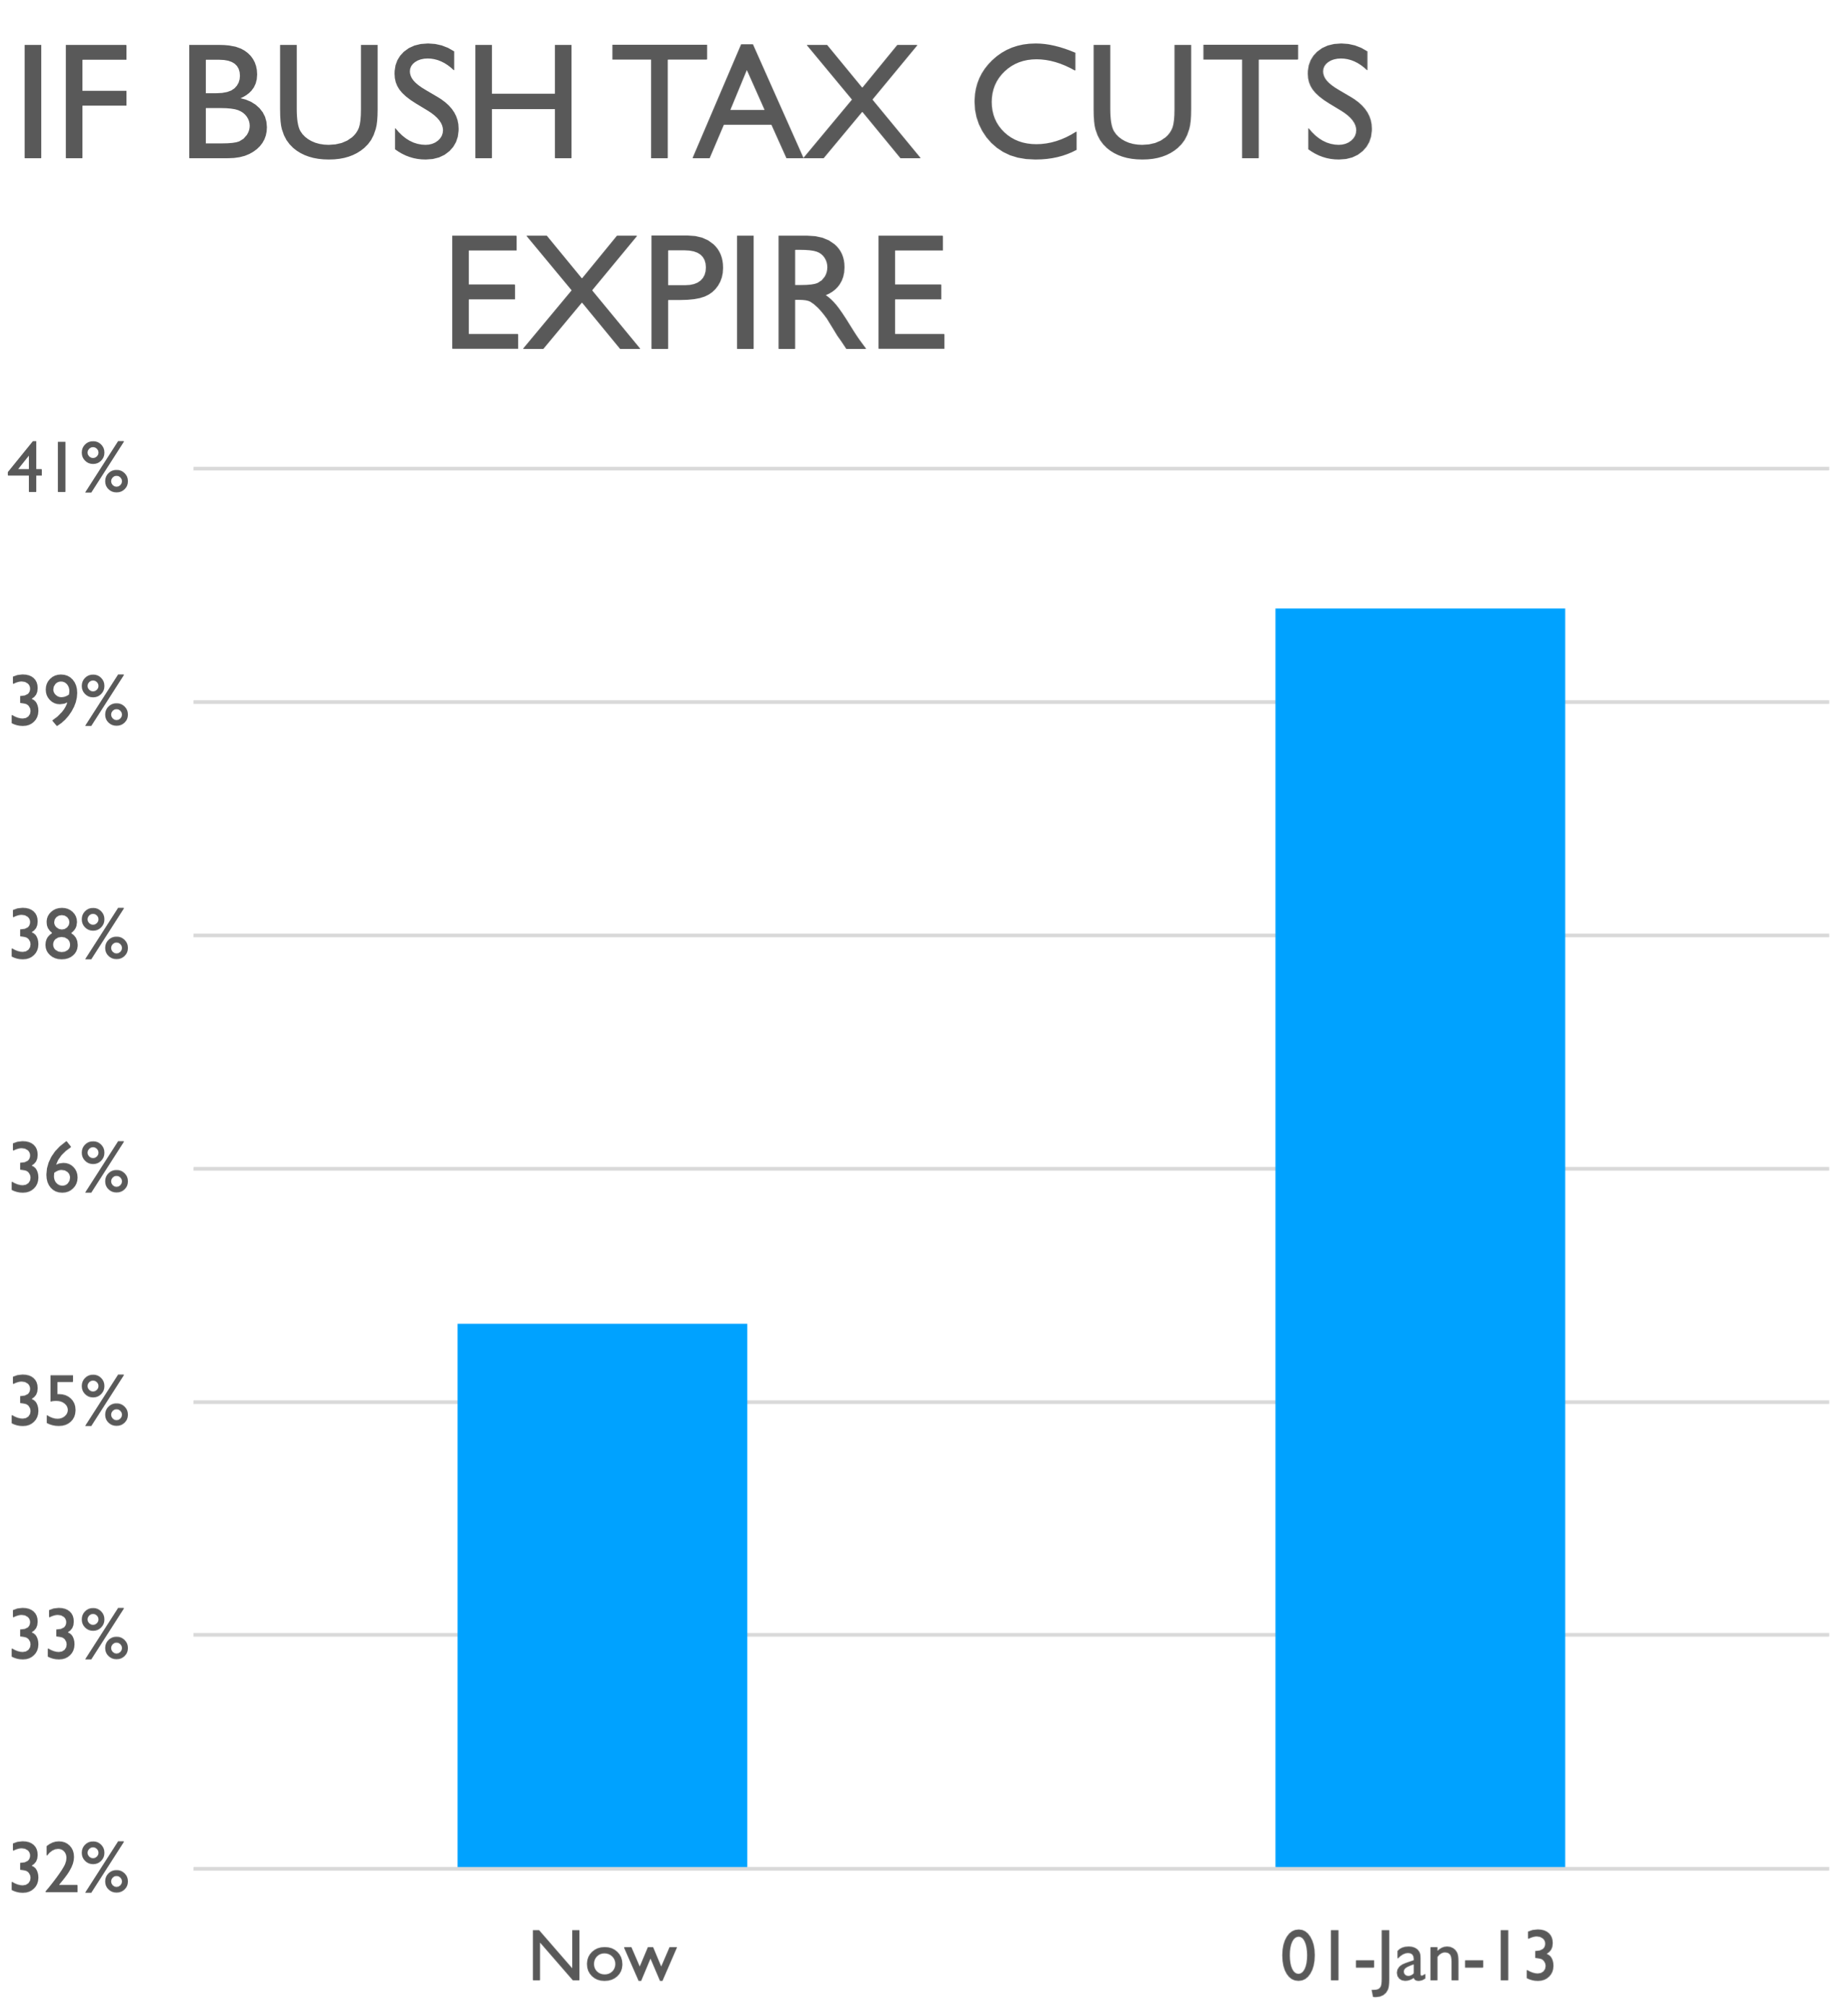
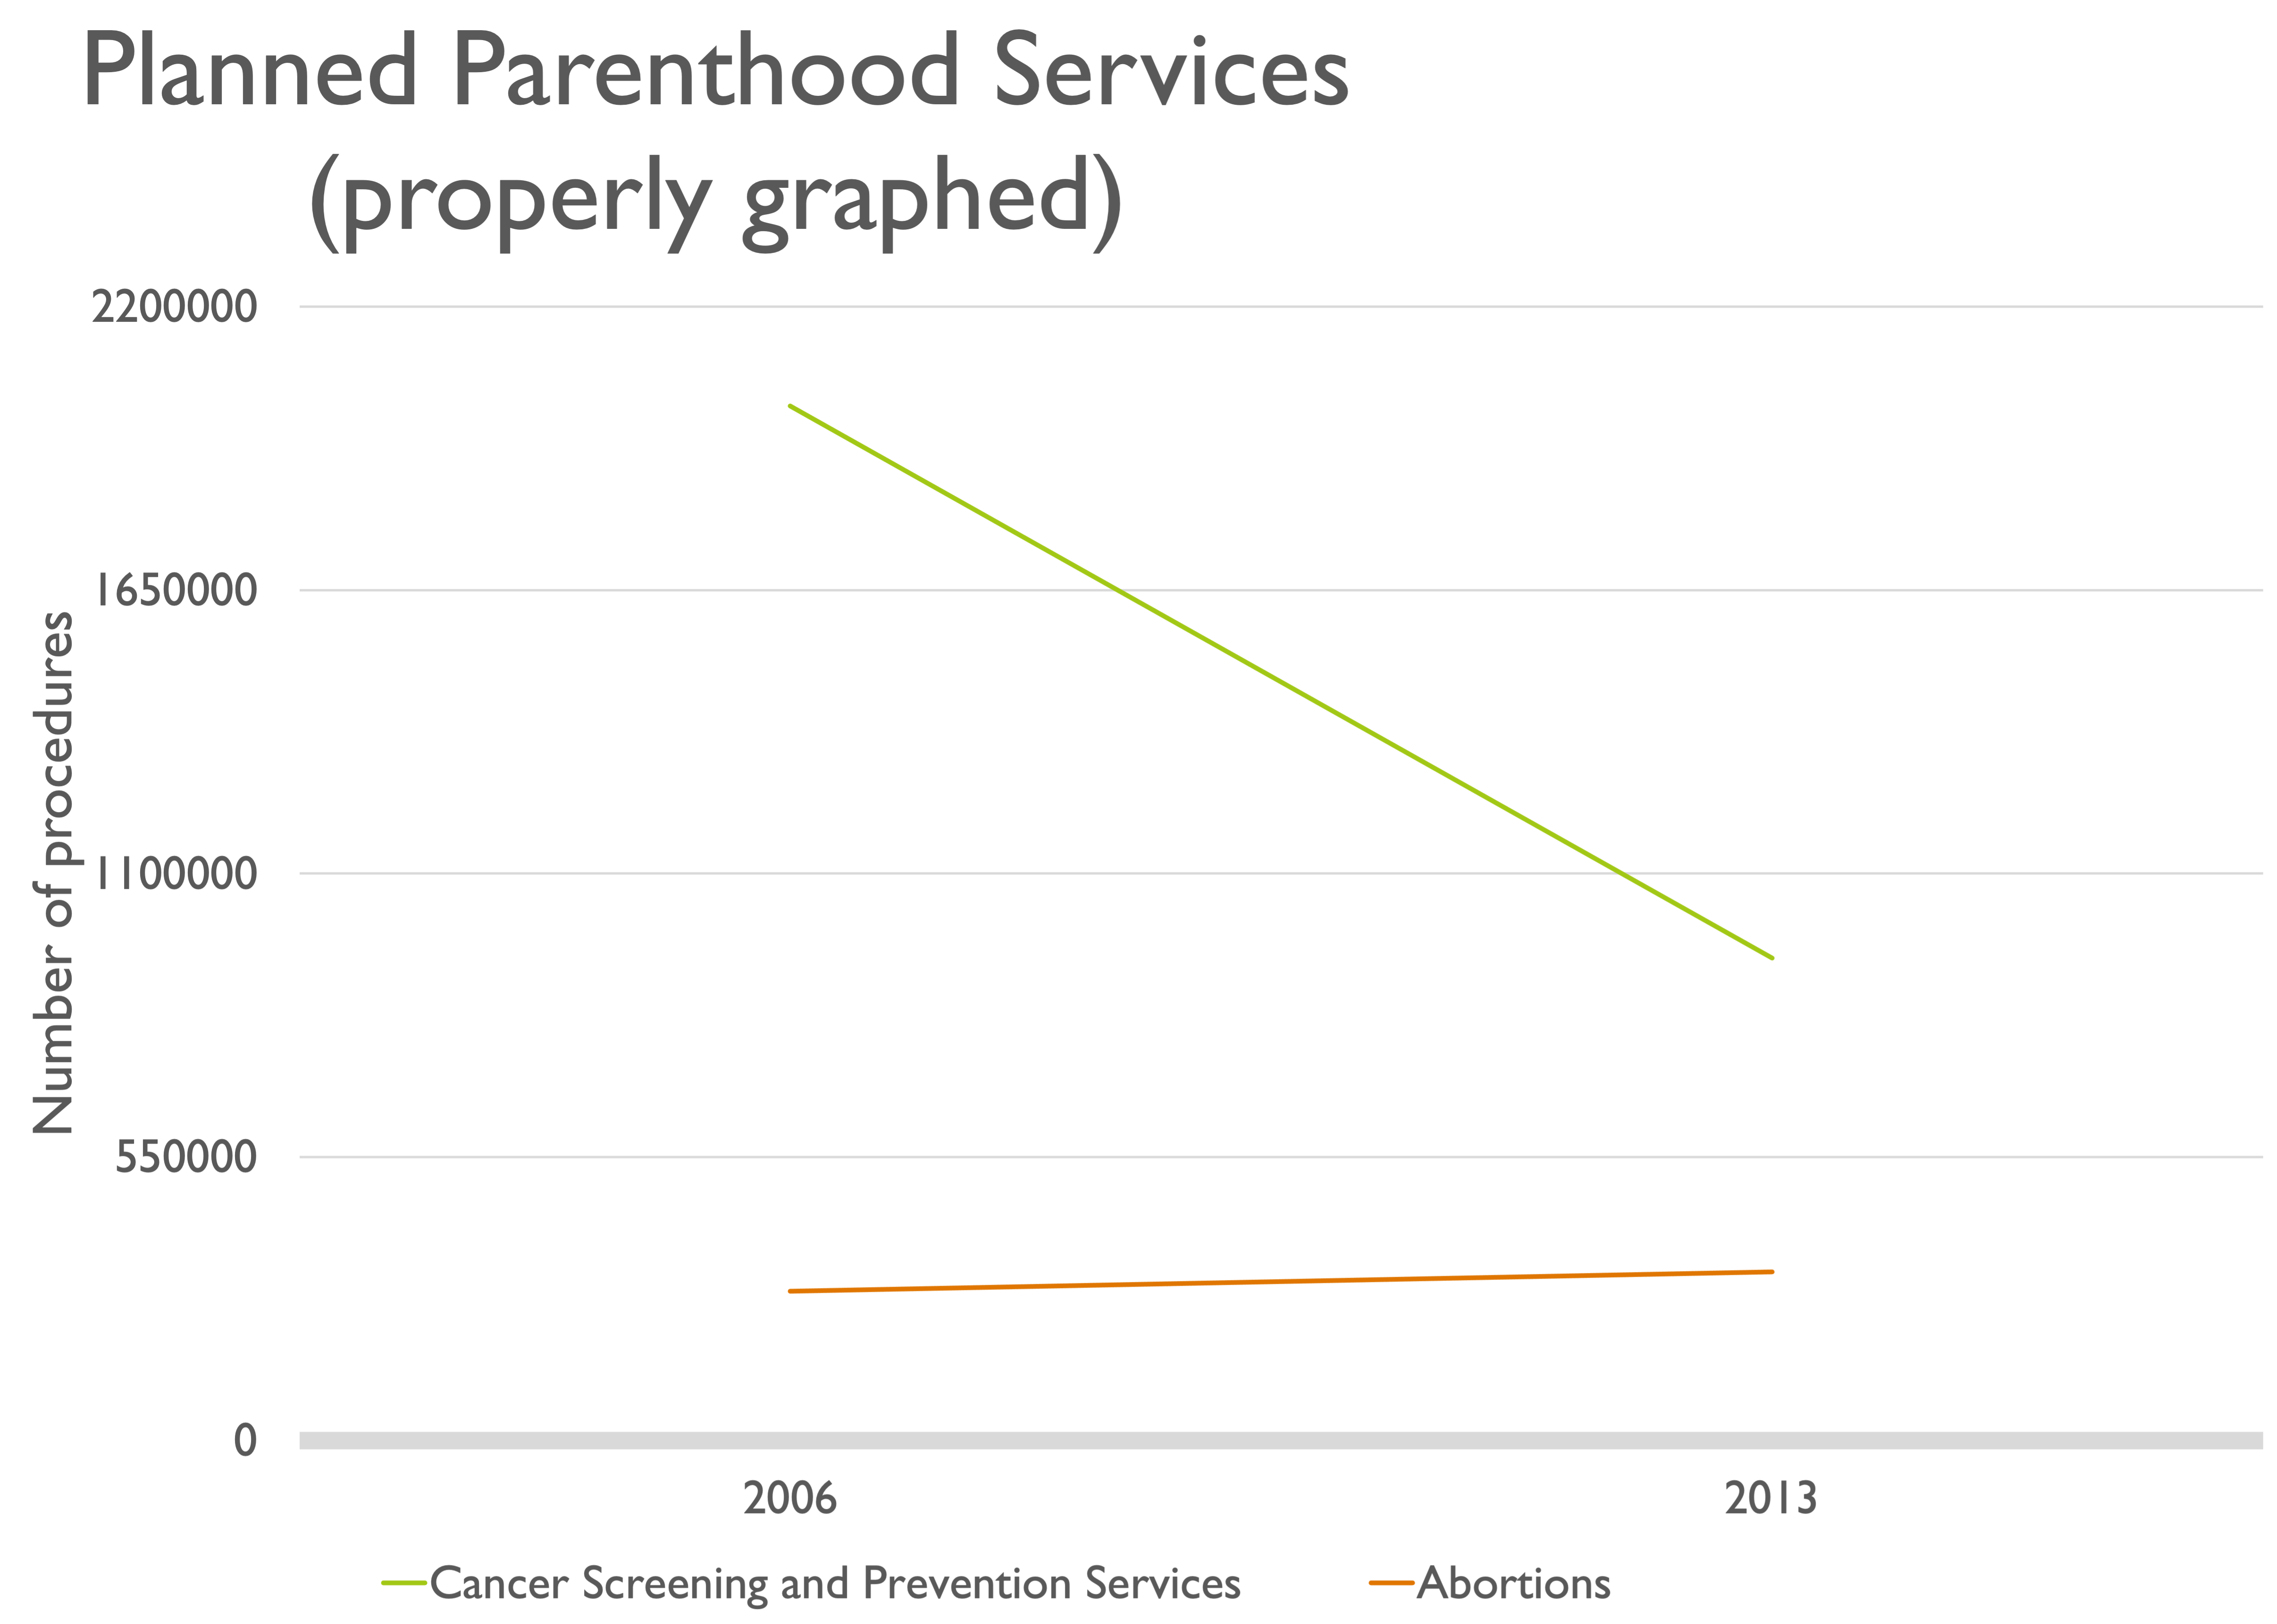
Corrected graph
Confusing or deceptive?
